Graphics in Python
The foundational package for most graphics in Python is
`matplotlib <http://matplotlib.org>`__, and the
`seaborn <http://stanford.edu/~mwaskom/software/seaborn/>`__ package
builds on this to provide more statistical graphing options. We will
focus on these two packages, but there are many others if these don’t
meet your needs.
There are also several specialized packages that might come in useful:
`ggplot<http://ggplot.yhathq.com>`__ is a port of the Rggplto2library to Python`vispy<http://vispy.org>`__ and`lightning<http://lightning-viz.org>`__ for interactive visualization of large data sets`bokeh<http://bokeh.pydata.org/en/latest/>`__ for web-friendly interactive graphics`pyxley<pyxley%20github>`__ and`spyre<spyre%20pyton>`__ for Rshinyfans and several others.
Resources
In [1]:
import warnings
warnings.filterwarnings("ignore")
Matplotlib
Matplotlib has a “functional” interface similar to Matlab via the
pyplot module for simple interactive use, as well as an
object-oriented interface that is useful for more complex graphic
creations.
Types of plots
In [2]:
plt.hist(np.random.randn(1000), bins=np.linspace(-4,4,11))
pass

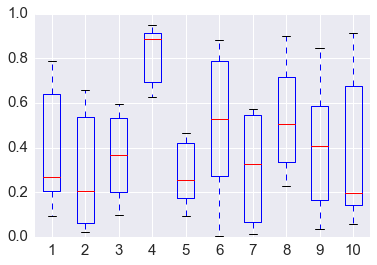
In [3]:
plt.boxplot(np.random.random((6,10)))
pass
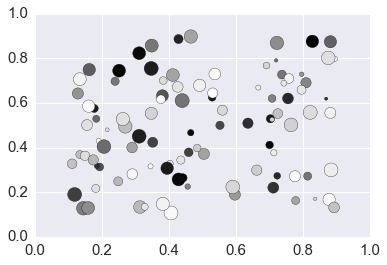
In [4]:
plt.scatter(*np.random.uniform(0.1, 0.9, (2,100)),
            s=np.random.randint(10, 200, 100),
            c=np.random.random(100))
pass
In [5]:
plt.stem(np.random.random(8))
plt.margins(0.05)
pass

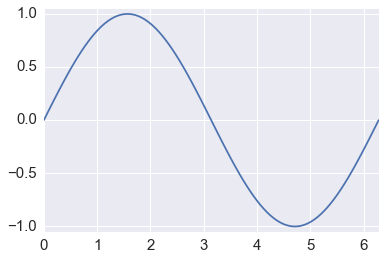
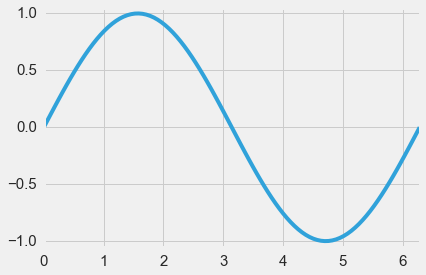
In [6]:
x = np.linspace(0, 2*np.pi, 100)
y = np.sin(x)
In [7]:
plt.plot(x, y)
plt.axis([0, 2*np.pi, -1.05, 1.05,])
pass
Colors
In [8]:
plt.scatter(*np.random.uniform(0.1, 0.9, (2,100)),
            s=np.random.randint(10, 200, 100),
            c=np.random.random(100))
pass

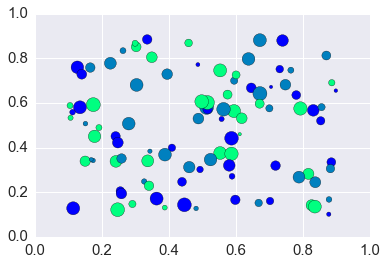
In [9]:
plt.scatter(*np.random.uniform(0.1, 0.9, (2,100)),
            s=np.random.randint(10, 200, 100),
            c=np.random.random(100), cmap='summer')
pass

In [10]:
plt.scatter(*np.random.uniform(0.1, 0.9, (2,100)),
            s=np.random.randint(10, 200, 100),
            c=np.random.random(100), cmap='hsv')
pass

Gettting a list of colors from a colormap
Giving an argument of 0.0 < x < 1.0 to a colormap gives the
appropriate interpolated color.
In [11]:
# find the bottom, middle and top colors of the winter colormap
colors = plt.cm.winter(np.linspace(0, 1, 3))
colors
Out[11]:
array([[ 0.        ,  0.        ,  1.        ,  1.        ],
       [ 0.        ,  0.50196078,  0.74901961,  1.        ],
       [ 0.        ,  1.        ,  0.5       ,  1.        ]])
In [12]:
plt.scatter(*np.random.uniform(0.1, 0.9, (2,100)),
            s=np.random.randint(10, 200, 100),
            c=colors)
pass
Styles
In [13]:
plt.style.available
Out[13]:
['seaborn-ticks',
 'seaborn-white',
 'seaborn-whitegrid',
 'seaborn-colorblind',
 'seaborn-pastel',
 'seaborn-poster',
 'seaborn-paper',
 'ggplot',
 'seaborn-deep',
 'bmh',
 'seaborn-talk',
 'seaborn-dark',
 'dark_background',
 'seaborn-bright',
 'fivethirtyeight',
 'seaborn-notebook',
 'classic',
 'presentation',
 'seaborn-muted',
 'seaborn-dark-palette',
 'grayscale',
 'seaborn-darkgrid']
In [14]:
with plt.style.context('classic'):
    plt.plot(x, y)
    plt.axis([0, 2*np.pi, -1.05, 1.05,])

In [15]:
with plt.style.context('fivethirtyeight'):
    plt.plot(x, y)
    plt.axis([0, 2*np.pi, -1.05, 1.05,])
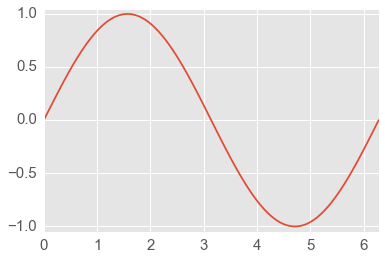
In [16]:
with plt.style.context('ggplot'):
    plt.plot(x, y)
    plt.axis([0, 2*np.pi, -1.05, 1.05,])
In [17]:
with plt.xkcd():
    plt.plot(x, y)
    plt.axis([0, 2*np.pi, -1.05, 1.05,])

Creating your onw style
Many, many options can be configured.
In [18]:
plt.rcParams
Out[18]:
RcParams({'agg.path.chunksize': 0,
          'animation.avconv_args': [],
          'animation.avconv_path': 'avconv',
          'animation.bitrate': -1,
          'animation.codec': 'mpeg4',
          'animation.convert_args': [],
          'animation.convert_path': 'convert',
          'animation.ffmpeg_args': [],
          'animation.ffmpeg_path': 'ffmpeg',
          'animation.frame_format': 'png',
          'animation.html': 'none',
          'animation.mencoder_args': [],
          'animation.mencoder_path': 'mencoder',
          'animation.writer': 'ffmpeg',
          'axes.axisbelow': True,
          'axes.edgecolor': 'white',
          'axes.facecolor': '#EAEAF2',
          'axes.formatter.limits': [-7, 7],
          'axes.formatter.use_locale': False,
          'axes.formatter.use_mathtext': False,
          'axes.formatter.useoffset': True,
          'axes.grid': True,
          'axes.grid.axis': 'both',
          'axes.grid.which': 'major',
          'axes.hold': True,
          'axes.labelcolor': '.15',
          'axes.labelpad': 5.0,
          'axes.labelsize': 16.5,
          'axes.labelweight': 'normal',
          'axes.linewidth': 0.0,
          'axes.prop_cycle': cycler('color', [(0.2980392156862745, 0.4470588235294118, 0.6901960784313725), (0.3333333333333333, 0.6588235294117647, 0.40784313725490196), (0.7686274509803922, 0.3058823529411765, 0.3215686274509804), (0.5058823529411764, 0.4470588235294118, 0.6980392156862745), (0.8, 0.7254901960784313, 0.4549019607843137), (0.39215686274509803, 0.7098039215686275, 0.803921568627451)]),
          'axes.spines.bottom': True,
          'axes.spines.left': True,
          'axes.spines.right': True,
          'axes.spines.top': True,
          'axes.titlesize': 18.0,
          'axes.titleweight': 'normal',
          'axes.unicode_minus': True,
          'axes.xmargin': 0.0,
          'axes.ymargin': 0.0,
          'axes3d.grid': True,
          'backend': 'module://ipykernel.pylab.backend_inline',
          'backend.qt4': 'PyQt4',
          'backend.qt5': 'PyQt5',
          'backend_fallback': True,
          'boxplot.bootstrap': None,
          'boxplot.boxprops.color': 'b',
          'boxplot.boxprops.linestyle': '-',
          'boxplot.boxprops.linewidth': 1.0,
          'boxplot.capprops.color': 'k',
          'boxplot.capprops.linestyle': '-',
          'boxplot.capprops.linewidth': 1.0,
          'boxplot.flierprops.color': 'b',
          'boxplot.flierprops.linestyle': 'none',
          'boxplot.flierprops.linewidth': 1.0,
          'boxplot.flierprops.marker': '+',
          'boxplot.flierprops.markeredgecolor': 'k',
          'boxplot.flierprops.markerfacecolor': 'b',
          'boxplot.flierprops.markersize': 6.0,
          'boxplot.meanline': False,
          'boxplot.meanprops.color': 'r',
          'boxplot.meanprops.linestyle': '-',
          'boxplot.meanprops.linewidth': 1.0,
          'boxplot.medianprops.color': 'r',
          'boxplot.medianprops.linestyle': '-',
          'boxplot.medianprops.linewidth': 1.0,
          'boxplot.notch': False,
          'boxplot.patchartist': False,
          'boxplot.showbox': True,
          'boxplot.showcaps': True,
          'boxplot.showfliers': True,
          'boxplot.showmeans': False,
          'boxplot.vertical': True,
          'boxplot.whiskerprops.color': 'b',
          'boxplot.whiskerprops.linestyle': '--',
          'boxplot.whiskerprops.linewidth': 1.0,
          'boxplot.whiskers': 1.5,
          'contour.corner_mask': True,
          'contour.negative_linestyle': 'dashed',
          'datapath': '/Users/cliburn/anaconda/envs/py35/lib/python3.5/site-packages/matplotlib/mpl-data',
          'docstring.hardcopy': False,
          'errorbar.capsize': 3.0,
          'examples.directory': '',
          'figure.autolayout': False,
          'figure.dpi': 80.0,
          'figure.edgecolor': (1, 1, 1, 0),
          'figure.facecolor': (1, 1, 1, 0),
          'figure.figsize': [6.0, 4.0],
          'figure.frameon': True,
          'figure.max_open_warning': 20,
          'figure.subplot.bottom': 0.125,
          'figure.subplot.hspace': 0.2,
          'figure.subplot.left': 0.125,
          'figure.subplot.right': 0.9,
          'figure.subplot.top': 0.9,
          'figure.subplot.wspace': 0.2,
          'figure.titlesize': 'medium',
          'figure.titleweight': 'normal',
          'font.cursive': ['Apple Chancery',
                           'Textile',
                           'Zapf Chancery',
                           'Sand',
                           'Script MT',
                           'Felipa',
                           'cursive'],
          'font.family': ['sans-serif'],
          'font.fantasy': ['Comic Sans MS',
                           'Chicago',
                           'Charcoal',
                           'ImpactWestern',
                           'Humor Sans',
                           'fantasy'],
          'font.monospace': ['Bitstream Vera Sans Mono',
                             'DejaVu Sans Mono',
                             'Andale Mono',
                             'Nimbus Mono L',
                             'Courier New',
                             'Courier',
                             'Fixed',
                             'Terminal',
                             'monospace'],
          'font.sans-serif': ['Arial',
                              'Liberation Sans',
                              'Bitstream Vera Sans',
                              'sans-serif'],
          'font.serif': ['Bitstream Vera Serif',
                         'DejaVu Serif',
                         'New Century Schoolbook',
                         'Century Schoolbook L',
                         'Utopia',
                         'ITC Bookman',
                         'Bookman',
                         'Nimbus Roman No9 L',
                         'Times New Roman',
                         'Times',
                         'Palatino',
                         'Charter',
                         'serif'],
          'font.size': 10.0,
          'font.stretch': 'normal',
          'font.style': 'normal',
          'font.variant': 'normal',
          'font.weight': 'normal',
          'grid.alpha': 1.0,
          'grid.color': 'white',
          'grid.linestyle': '-',
          'grid.linewidth': 1.0,
          'image.aspect': 'equal',
          'image.cmap': 'Greys',
          'image.composite_image': True,
          'image.interpolation': 'bilinear',
          'image.lut': 256,
          'image.origin': 'upper',
          'image.resample': False,
          'interactive': True,
          'keymap.all_axes': ['a'],
          'keymap.back': ['left', 'c', 'backspace'],
          'keymap.forward': ['right', 'v'],
          'keymap.fullscreen': ['f', 'ctrl+f'],
          'keymap.grid': ['g'],
          'keymap.home': ['h', 'r', 'home'],
          'keymap.pan': ['p'],
          'keymap.quit': ['ctrl+w', 'cmd+w'],
          'keymap.save': ['s', 'ctrl+s'],
          'keymap.xscale': ['k', 'L'],
          'keymap.yscale': ['l'],
          'keymap.zoom': ['o'],
          'legend.borderaxespad': 0.5,
          'legend.borderpad': 0.4,
          'legend.columnspacing': 2.0,
          'legend.edgecolor': 'inherit',
          'legend.facecolor': 'inherit',
          'legend.fancybox': False,
          'legend.fontsize': 15.0,
          'legend.framealpha': None,
          'legend.frameon': False,
          'legend.handleheight': 0.7,
          'legend.handlelength': 2.0,
          'legend.handletextpad': 0.8,
          'legend.isaxes': True,
          'legend.labelspacing': 0.5,
          'legend.loc': 'upper right',
          'legend.markerscale': 1.0,
          'legend.numpoints': 1,
          'legend.scatterpoints': 1,
          'legend.shadow': False,
          'lines.antialiased': True,
          'lines.color': 'b',
          'lines.dash_capstyle': 'butt',
          'lines.dash_joinstyle': 'round',
          'lines.linestyle': '-',
          'lines.linewidth': 1.75,
          'lines.marker': 'None',
          'lines.markeredgewidth': 0.0,
          'lines.markersize': 7.0,
          'lines.solid_capstyle': 'round',
          'lines.solid_joinstyle': 'round',
          'markers.fillstyle': 'full',
          'mathtext.bf': 'serif:bold',
          'mathtext.cal': 'cursive',
          'mathtext.default': 'it',
          'mathtext.fallback_to_cm': True,
          'mathtext.fontset': 'cm',
          'mathtext.it': 'serif:italic',
          'mathtext.rm': 'serif',
          'mathtext.sf': 'sans\\-serif',
          'mathtext.tt': 'monospace',
          'nbagg.transparent': True,
          'patch.antialiased': True,
          'patch.edgecolor': 'k',
          'patch.facecolor': (0.2980392156862745,
                              0.4470588235294118,
                              0.6901960784313725),
          'patch.linewidth': 0.3,
          'path.effects': [],
          'path.simplify': True,
          'path.simplify_threshold': 0.1111111111111111,
          'path.sketch': None,
          'path.snap': True,
          'pdf.compression': 6,
          'pdf.fonttype': 3,
          'pdf.inheritcolor': False,
          'pdf.use14corefonts': False,
          'pgf.debug': False,
          'pgf.preamble': [],
          'pgf.rcfonts': True,
          'pgf.texsystem': 'xelatex',
          'plugins.directory': '.matplotlib_plugins',
          'polaraxes.grid': True,
          'ps.distiller.res': 6000,
          'ps.fonttype': 3,
          'ps.papersize': 'letter',
          'ps.useafm': False,
          'ps.usedistiller': False,
          'savefig.bbox': None,
          'savefig.directory': '~',
          'savefig.dpi': 72.0,
          'savefig.edgecolor': 'w',
          'savefig.facecolor': 'w',
          'savefig.format': 'png',
          'savefig.frameon': True,
          'savefig.jpeg_quality': 95,
          'savefig.orientation': 'portrait',
          'savefig.pad_inches': 0.1,
          'savefig.transparent': False,
          'svg.fonttype': 'path',
          'svg.image_inline': True,
          'svg.image_noscale': False,
          'text.antialiased': True,
          'text.color': '.15',
          'text.dvipnghack': None,
          'text.hinting': 'auto',
          'text.hinting_factor': 8,
          'text.latex.preamble': [],
          'text.latex.preview': False,
          'text.latex.unicode': False,
          'text.usetex': False,
          'timezone': 'UTC',
          'tk.window_focus': False,
          'toolbar': 'toolbar2',
          'verbose.fileo': 'sys.stdout',
          'verbose.level': 'silent',
          'webagg.open_in_browser': True,
          'webagg.port': 8988,
          'webagg.port_retries': 50,
          'xtick.color': '.15',
          'xtick.direction': 'out',
          'xtick.labelsize': 15.0,
          'xtick.major.pad': 7.0,
          'xtick.major.size': 0.0,
          'xtick.major.width': 1.0,
          'xtick.minor.pad': 4.0,
          'xtick.minor.size': 0.0,
          'xtick.minor.visible': False,
          'xtick.minor.width': 0.5,
          'ytick.color': '.15',
          'ytick.direction': 'out',
          'ytick.labelsize': 15.0,
          'ytick.major.pad': 7.0,
          'ytick.major.size': 0.0,
          'ytick.major.width': 1.0,
          'ytick.minor.pad': 4.0,
          'ytick.minor.size': 0.0,
          'ytick.minor.visible': False,
          'ytick.minor.width': 0.5})
In [19]:
%%file foo.mplstyle
axes.grid: True
axes.titlesize : 24
axes.labelsize : 20
lines.linewidth : 3
lines.markersize : 10
xtick.labelsize : 16
ytick.labelsize : 16
Overwriting foo.mplstyle
In [20]:
with plt.style.context('foo.mplstyle'):
    plt.plot(x, y)
    plt.axis([0, 2*np.pi, -1.05, 1.05,])

Customizing plots
In [21]:
plt.rcParams.update({'font.size': 22})

fig = plt.figure(figsize=(8,6))
ax = plt.subplot(1,1,1)
plt.plot(x, y, color='red', linewidth=2, linestyle='dashed', label='sine curve')
plt.plot(x, np.cos(x), 'b-', label='cosine curve')
plt.legend(loc='best', fontsize=14)
plt.axis([0, 2*np.pi, -1.05, 1.05,])
plt.xlabel('x')
plt.ylabel('sin(x)')
plt.xticks([0,0.5*np.pi,np.pi,1.5*np.pi,2*np.pi],
           [0, r'$\frac{\pi}{2}$', r'$\pi$', r'$\frac{3\pi}{2}$', r'$2\pi$'])
plt.title('Sine and Cosine Plots')
plt.text(0.45, 0.9, 'Empty space', transform=ax.transAxes, ha='left', va='top')
pass

Plot layouts
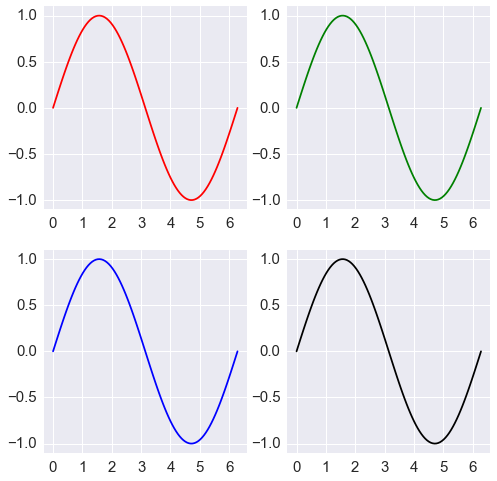
In [22]:
fig, axes = plt.subplots(2,2,figsize=(8,8))
axes[0,0].plot(x,y, 'r')
axes[0,1].plot(x,y, 'g')
axes[1,0].plot(x,y, 'b')
axes[1,1].plot(x,y, 'k')
for ax in axes.ravel():
    ax.margins(0.05)
pass
In [23]:
ax1 = plt.subplot2grid((3,3), (0,0), colspan=3)
ax2 = plt.subplot2grid((3,3), (1,0), colspan=2)
ax3 = plt.subplot2grid((3,3), (1,2), rowspan=2)
ax4 = plt.subplot2grid((3,3), (2,0), colspan=2)
axes = [ax1, ax2, ax3, ax4]
colors = ['r', 'g', 'b', 'k']
for ax, c in zip(axes, colors):
    ax.plot(x, y, c)
    ax.margins(0.05)
plt.tight_layout()

Seaborn
In [24]:
sns.set_context("notebook", font_scale=1.5, rc={"lines.linewidth": 2.5})
In [25]:
import numpy.random as rng
Density plots
In [26]:
xs = rng.normal(0,1,100)

fig, axes = plt.subplots(1, 2, figsize=(8,4))
sns.distplot(xs, hist=False, rug=True, ax=axes[0]);
sns.distplot(xs, hist=True, ax=axes[1])
pass

Kernel density estimate
In [27]:
sns.kdeplot(np.r_[rng.normal(0,1,50), rng.normal(4,0.8,100)])
pass

In [28]:
iris = sns.load_dataset('iris')
In [29]:
iris.head()
Out[29]:
| sepal_length | sepal_width | petal_length | petal_width | species | |
|---|---|---|---|---|---|
| 0 | 5.1 | 3.5 | 1.4 | 0.2 | setosa |
| 1 | 4.9 | 3.0 | 1.4 | 0.2 | setosa |
| 2 | 4.7 | 3.2 | 1.3 | 0.2 | setosa |
| 3 | 4.6 | 3.1 | 1.5 | 0.2 | setosa |
| 4 | 5.0 | 3.6 | 1.4 | 0.2 | setosa |
Joint distribution plot
In [30]:
sns.jointplot(x='petal_length', y='petal_width', data=iris, kind='kdeplot')
pass

Box and violin plots
In [31]:
fig, axes = plt.subplots(1, 2, figsize=(8,4))

sns.boxplot(x='species', y='petal_length', data=iris, ax=axes[0])
sns.violinplot(x='species', y='petal_length', data=iris, ax=axes[1])
pass

Composite plots
In [32]:
url = 'https://raw.githubusercontent.com/mwaskom/seaborn-data/master/titanic.csv'
titanic = pd.read_csv(url)
In [33]:
titanic.head()
Out[33]:
| survived | pclass | sex | age | sibsp | parch | fare | embarked | class | who | adult_male | deck | embark_town | alive | alone | |
|---|---|---|---|---|---|---|---|---|---|---|---|---|---|---|---|
| 0 | 0 | 3 | male | 22 | 1 | 0 | 7.2500 | S | Third | man | True | NaN | Southampton | no | False |
| 1 | 1 | 1 | female | 38 | 1 | 0 | 71.2833 | C | First | woman | False | C | Cherbourg | yes | False |
| 2 | 1 | 3 | female | 26 | 0 | 0 | 7.9250 | S | Third | woman | False | NaN | Southampton | yes | True |
| 3 | 1 | 1 | female | 35 | 1 | 0 | 53.1000 | S | First | woman | False | C | Southampton | yes | False |
| 4 | 0 | 3 | male | 35 | 0 | 0 | 8.0500 | S | Third | man | True | NaN | Southampton | no | True |
In [34]:
sns.set_context('notebook', font_scale=1.5)
In [35]:
sns.lmplot(x='fare', y='survived', col='alone', row='sex', data=titanic, logistic=True)
pass

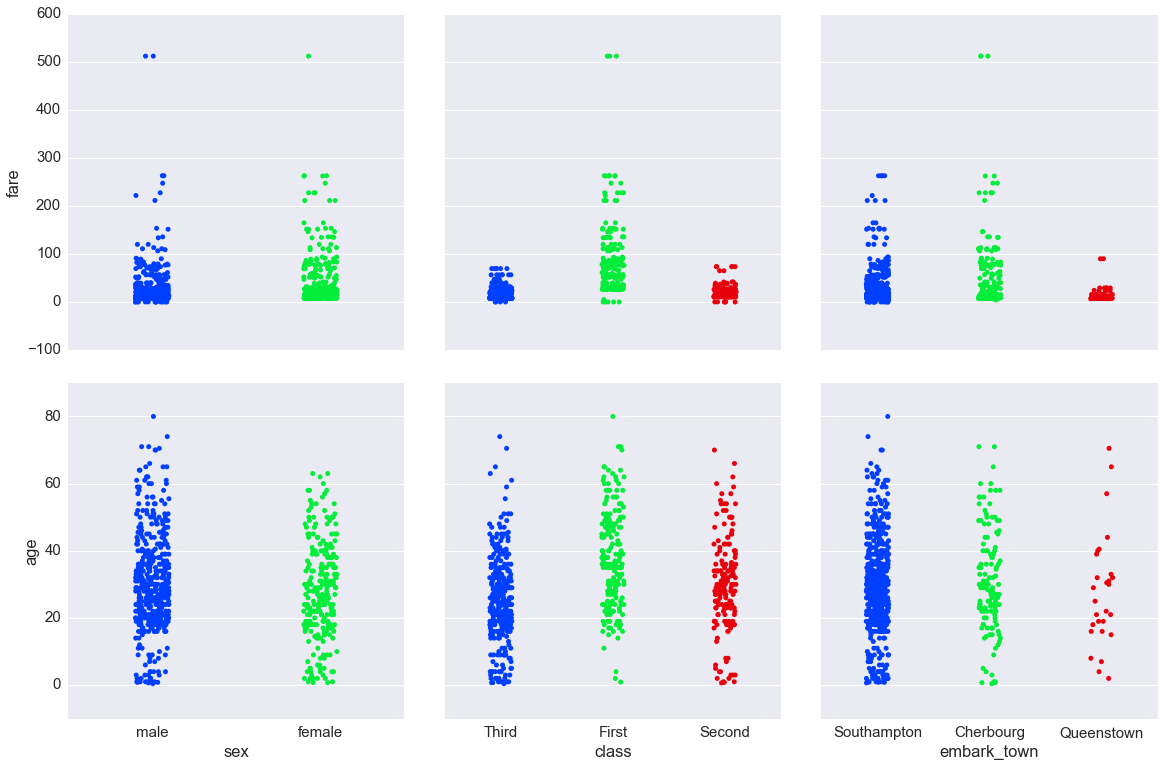
In [36]:
g = sns.PairGrid(titanic,
                 y_vars=['fare', 'age'],
                 x_vars=['sex', 'class', 'embark_town' ],
                 aspect=1, size=5.5)
g.map(sns.stripplot, jitter=True, palette="bright")
pass
Using ggplot as an alternative to seaborn.
The ggplot module is a port of R’s ggplot2 - usage is very
similar except for the following minor differences:
- Pass in a
pandasdataframe - aethetics comes befor data in the argument list ot ggplot
- Give column names and other arugments (e.g.. function to call) as strings
- You need to use the line continuation character
\to extend over multiple lines
Only the most elementary examples are shown below. The ggplot module
is extremely rich and sophisticated with a steep learning curve if
you’re not already familiar with it from R. Please see
documentation for
details.
In [37]:
from ggplot import *
Interacting with R
In [38]:
%load_ext rpy2.ipython
Note that we are exporting the R mtcars dataframe to Python (converts to pandas DataFrame)
In [39]:
%R -o mtcars
In [40]:
mtcars.head()
Out[40]:
| mpg | cyl | disp | hp | drat | wt | qsec | vs | am | gear | carb | |
|---|---|---|---|---|---|---|---|---|---|---|---|
| Mazda RX4 | 21.0 | 6 | 160 | 110 | 3.90 | 2.620 | 16.46 | 0 | 1 | 4 | 4 |
| Mazda RX4 Wag | 21.0 | 6 | 160 | 110 | 3.90 | 2.875 | 17.02 | 0 | 1 | 4 | 4 |
| Datsun 710 | 22.8 | 4 | 108 | 93 | 3.85 | 2.320 | 18.61 | 1 | 1 | 4 | 1 |
| Hornet 4 Drive | 21.4 | 6 | 258 | 110 | 3.08 | 3.215 | 19.44 | 1 | 0 | 3 | 1 |
| Hornet Sportabout | 18.7 | 8 | 360 | 175 | 3.15 | 3.440 | 17.02 | 0 | 0 | 3 | 2 |
In [41]:
ggplot(aes(x='wt', y='mpg'), data=mtcars,) + geom_point()

Out[41]:
<ggplot: (292414163)>
In [42]:
ggplot(aes(x='wt', y='mpg'), data=mtcars) + geom_point() + geom_smooth(method='loess')

Out[42]:
<ggplot: (292201757)>
In [43]:
ggplot(aes(x='wt', y='mpg'), data=mtcars) + geom_point() + geom_line()
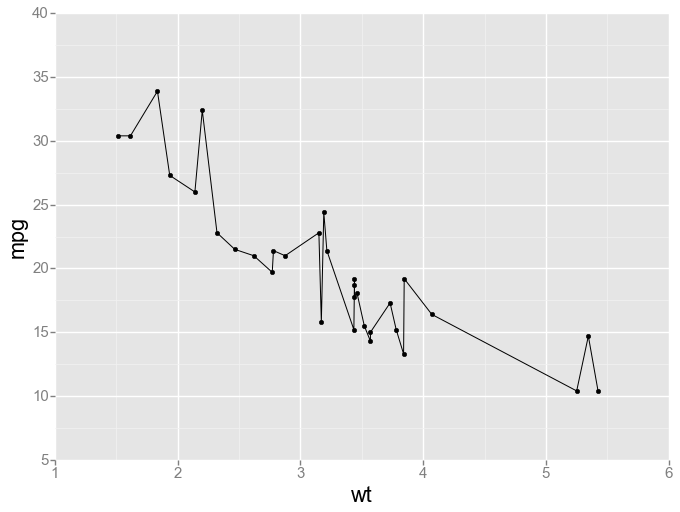
Out[43]:
<ggplot: (287265863)>
In [44]:
ggplot(aes(x='mpg'), data=mtcars) + geom_histogram(binwidth=2)

Out[44]:
<ggplot: (-9223372036566578744)>
In [45]:
ggplot(aes(x='mpg'), mtcars) + \
geom_line(stat="density") + \
xlim(2.97, 41.33) + \
labs(title="Density plot")

Out[45]:
<ggplot: (288465612)>
Use ggplot in R directly with %R magic
In [46]:
cars = mtcars
Note that we pass in Python variables with the -i optin and using the %%R cell magic
In [52]:
%%R -i cars
library('ggplot2')
ggplot(cars, aes(x=mpg, y=am)) +
geom_point(position=position_jitter(width=.3, height=.08), shape=21, alpha=0.6, size=3) +
stat_smooth(method=glm, method.args=list(family="binomial"), color="red")

Version Information
In [48]:
%load_ext version_information
%version_information numpy, matplotlib, seaborn
Out[48]:
| Software | Version |
|---|---|
| Python | 3.5.1 64bit [GCC 4.2.1 (Apple Inc. build 5577)] |
| IPython | 4.0.1 |
| OS | Darwin 15.3.0 x86_64 i386 64bit |
| numpy | 1.10.4 |
| matplotlib | 1.5.1 |
| seaborn | 0.7.0 |
| Tue Feb 09 15:58:21 2016 EST | |
In [ ]: