Basic Plotting
Finally, at long last, we're going to take a look at plotting data. Part of the reason we've put this off so long is that the trickier Matlab concepts are harder to learn and benefit from more practice. The other reason is that plotting in most real-world scenarios requires lots of manipulation to get the data into a usable format, and so it's not much good to teach plotting commands until you're confident manipulating data.
Contents
Getting Started
Let's make some fake data and plot it:
times = 0:0.001:3; % from 0 to 3 in steps of 0.001 (1 ms)
signal = sin(2*pi*5*times)+times+0.5*randn(1,length(times));
plot(times, signal); %of the form plot(xdata,ydata)

Practice Problem 1
Try decimating (plotting only every tenth data point) of signal defined above.
Changing Plot Properties
There are lots of options to plot, controlled by what are called "Property-Value" pairs. We specify these by including in the arguments to plot a string giving the name of the relevant property followed by a comma and the value it should take.
plot(times,signal,'color','k','linewidth',2.0) %plot in black, with a thicker line
box off  %remove the upper and right axis lines
xlim([0 1]) %change the xlimits of the plot

Practice Problem 2
Redo the above plot, but restrict the plot range to be between y=-1 and y=1
Multiple Data Series
When we call plot, Matlab will overwrite what's in the current window. To prevent this from happening, we can call hold.
clf %clear the figure window
plot(times,signal)
hold all
plot(times, signal.^2/3)

Alternately, if we supply array-valued ydata to Matlab, it will treat each column as a separate data series to plot:
randstep = randn(1000,5);  %1000 x 5 matrix of normally distributed step sizes
randwalk = cumsum(randstep); %take the cumulative sum down each column (sum of all previous steps to that point)
plot(randwalk) %if no xdata are supplied, Matlab will assume xdata are integer indices

Practice Problem 3
Plot only the time series contained in the first, third, and fifth columns of randwalk.
Histograms
For discrete data, all the usual plots are available. Google is your friend.
samp1 = 1+0.5*randn(500,1);
samp2 = 3+0.9*randn(800,1);
bimodal=[samp1 ; samp2]; %concatenate
clf
hist(bimodal,100) %second argument is number of bins
xlabel('Value Observed')
ylabel('Count')

Practice Problem 4
What happens if you make the number of bins much larger? Much smaller?
Scatter Plots
Along the same lines,
M1 = [1 1]; M2 = [-1 0.7]; M3 = [0 3]; %means
S1 = 0.3*[1 0.5 ; 0.5 1]; S2 = 0.2*[1 0.1 ; 0.1 1]; S3 = 0.5*[1 -0.9 ; -0.9 1];  %covariances
N1 = 1000; N2 = 800; N3 = 2000;
samp1 = mvnrnd(M1,S1,N1);
samp2 = mvnrnd(M2,S2,N2);
samp3 = mvnrnd(M3,S3,N3);
allpts = [samp1 ; samp2 ; samp3];
scatter(allpts(:,1),allpts(:,2),'sizedata',50.0,'markeredgecolor','none',...
    'markerfacecolor','k')
title('scatterplot with 3 clusters')

Practice Problem 5
Reproduce the scatter plot, but use hold all and multiple plot commands to plot the different samples in different colors.
Boxplots
If we have data separated out by a grouping variable (or into columns in a matrix), we can compare across groups:
samp(:,1) = 1 + randn(100,1);
samp(:,2) = 0.5 + 0.2*randn(100,1);
samp(:,3) = 1.7 + 0.5*randn(100,1);
samp(:,4) = -0.25 + randn(100,1);
boxplot(samp,'notch','on','labels',{'group1','group2','group3','group4'})

Practice Problem 6
Look at the documentation for boxplot and change the above plot command so that the boxes are filled in. (This may result in the boxes thinning to a more compact mode.
Patches
Finally, if we have coordinates surrounding a region, we can fill that region in, outline it, etc. using patch:
b1 = 2; %slope
b0 = 1; %intercept
sig = 4; %standard deviation
xvals = -2:0.5:12;

y = b1*xvals + b0 + sig*randn(1,length(xvals)); %draw data from a linear model

scatter(xvals,y,'markeredgecolor','none','markerfacecolor','k') %scatterplot data values
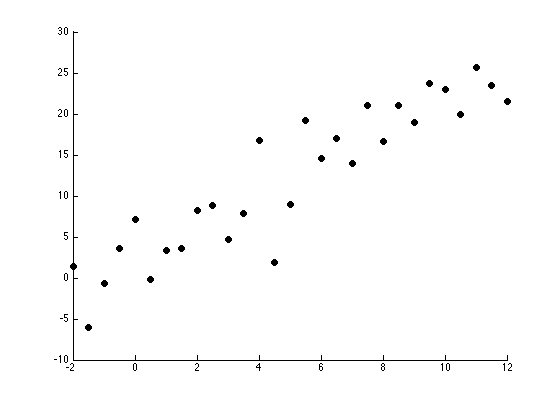
Now let's try something fun: let's fit a regression line to this data:
[beta,S] = polyfit(xvals,y,1); %fit a first-order polynomial (i.e., line)

%beta contains the coefficients, and S contains structure information about
%the fit

%and we can plot the regression line on the original plot
hold all
plot(xvals,beta(1)*xvals+beta(2),'r','linewidth',1.5)
hold off

But how uncertain can we be about making predictions?
bigx=-2:0.01:12;

[ypred,yerr] = polyval(beta,bigx,S); %ypred is the prediction, yerr is the standard deviation
We can plot this using patch:
yupper = ypred + yerr;
ylower = ypred - yerr;

hold all
patch([bigx fliplr(bigx)],[ylower fliplr(yupper)],'k','facealpha',0.25,...
    'edgecolor','none') %facealpha controls transparency
hold off

NB: The missing axes are a function of the fact that Matlab sometimes has trouble printing figures when you use the patch command. More on that next semester...
Further Reading
For more basic plotting help, try Matlab: Plotting Functions
To change graphical properties of figures, you will need to know what's capable of being changed. This information can also be found in the Matlab help.
- For line plots, Lineseries
- For scatterplots, Scattergroup
- For bar graphs, histograms, etc., Barseries
- For axis properties (tick marks, labels, line widths, etc.) Axes Properties