More Python, numpy and sklearn
We will use the following data sets:
titanic = sns.load_dataset("titanic")
iris = sns.load_dataset("iris")
Q1 (20 pts) Working with numpy.random.
Part 1 (10 pts) Consider a sequence of \(n\) Bernoulli trials with success probabilty \(p\) per trial. A string of consecutive successes is known as a success run. Write a function that returns the counts for runs of length \(k\) for each \(k\) observed in a dictionary.
For example: if the trials were [0, 1, 0, 1, 1, 0, 0, 0, 0, 1], the function should return
{1: 2, 2: 1})
In [1]:
Part 2 (10 pts) Continuing from Part 1, what is the probability of observing at least one run of length 5 or more when \(n=100\) and \(p=0.5\)?. Estimate this from 100,000 simulated experiments. Is this more, less or equally likely than finding runs of length 7 or more when \(p=0.7\)?
In [1]:
Q2. (30 pts)
Using RandomForestClassifier from sklearn, find the 5 most
important predictors of survival on the Titanic. Compare the accuracy of
prediction using only these 5 predictors and using all non-redundant
predictors. Some intial pre-processing code is provided. Hint: check out
the pandas.get_dummies() function.
In [1]:
titanic = sns.load_dataset("titanic")
titanic.head()
Out[1]:
| survived | pclass | sex | age | sibsp | parch | fare | embarked | class | who | adult_male | deck | embark_town | alive | alone | |
|---|---|---|---|---|---|---|---|---|---|---|---|---|---|---|---|
| 0 | 0 | 3 | male | 22.0 | 1 | 0 | 7.2500 | S | Third | man | True | NaN | Southampton | no | False |
| 1 | 1 | 1 | female | 38.0 | 1 | 0 | 71.2833 | C | First | woman | False | C | Cherbourg | yes | False |
| 2 | 1 | 3 | female | 26.0 | 0 | 0 | 7.9250 | S | Third | woman | False | NaN | Southampton | yes | True |
| 3 | 1 | 1 | female | 35.0 | 1 | 0 | 53.1000 | S | First | woman | False | C | Southampton | yes | False |
| 4 | 0 | 3 | male | 35.0 | 0 | 0 | 8.0500 | S | Third | man | True | NaN | Southampton | no | True |
In [2]:
titanic.drop(['alive', 'embarked', 'class', 'who', 'adult_male'], axis=1, inplace=True)
titanic.dropna(axis=0, inplace=True)
titanic.head()
Out[2]:
| survived | pclass | sex | age | sibsp | parch | fare | deck | embark_town | alone | |
|---|---|---|---|---|---|---|---|---|---|---|
| 1 | 1 | 1 | female | 38.0 | 1 | 0 | 71.2833 | C | Cherbourg | False |
| 3 | 1 | 1 | female | 35.0 | 1 | 0 | 53.1000 | C | Southampton | False |
| 6 | 0 | 1 | male | 54.0 | 0 | 0 | 51.8625 | E | Southampton | True |
| 10 | 1 | 3 | female | 4.0 | 1 | 1 | 16.7000 | G | Southampton | False |
| 11 | 1 | 1 | female | 58.0 | 0 | 0 | 26.5500 | C | Southampton | True |
In [3]:
Q2. (25 pts)
Using sklearn, perform unsupervised learning of the iris data using
2 different clustering methods. Do NOT assume you know the number of
clusters - rather the code should either determine it from the data or
compare models with different numbers of components using some
appropriate test statistic. Make a pairwise scatter plot of the four
predictor variables indicating cluster by color for each unsupervised
learning method used.
In [3]:
Q3. (50 pts)
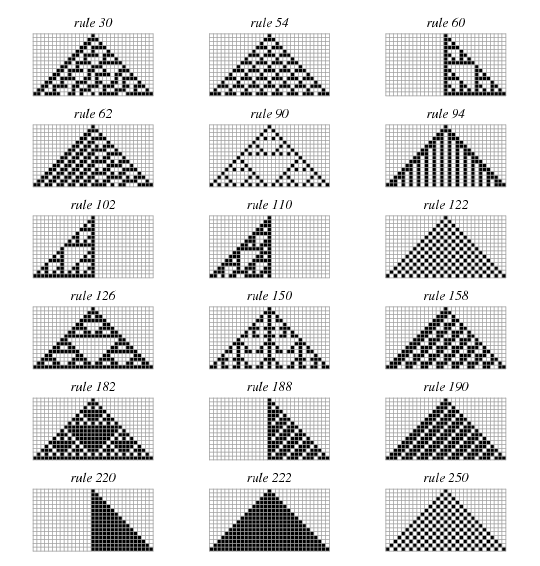
Write code to generate a plot similar to the following  using
the explanation for generation of 1D Cellular Automata found
here.
You should only need to use standard Python,
 numpy and
matplotllib.
To make it simpler, I have provided the code for plotting below. All you
need to do is to supply the make_ca function (which may of course
use as many ohter custom functons as you deem necessary). As you can see
from the code below, the make_ca function takes 3 arguments
rule - an integer e.g. 30
init - an initial state i.e. the first row of the image
niter - the number of iterations i.e. the number of rows in the image
In [3]:
In [3]:
from matplotlib.ticker import NullFormatter, IndexLocator

def plot_grid(rule, grid, ax=None):
    if ax is None:
        ax = plt.subplot(111)
    ax.grid(True, which='major', color='grey', linewidth=0.5)
    ax.imshow(grid, interpolation='none', cmap='Greys', aspect=1, alpha=0.8)
    ax.xaxis.set_major_locator(IndexLocator(1, 0))
    ax.yaxis.set_major_locator(IndexLocator(1, 0))
    ax.xaxis.set_major_formatter( NullFormatter() )
    ax.yaxis.set_major_formatter( NullFormatter() )
    ax.set_title('Rule %d' % rule)
In [4]:
niter = 15
width = niter*2+1
init = np.zeros(width, 'int')
init[width//2] = 1
rules = np.array([30, 54, 60, 62, 90, 94, 102, 110, 122, 126,
                  150, 158, 182, 188, 190, 220, 222, 250]).reshape((-1, 3))

nrows, ncols = rules.shape
fig, axes = plt.subplots(nrows, ncols, figsize=(ncols*3, nrows*2))
for i in range(nrows):
    for j in range(ncols):
        grid = make_ca(rules[i, j], init, niter)
        plot_grid(rules[i, j], grid, ax=axes[i,j])
plt.tight_layout()
---------------------------------------------------------------------------
NameError                                 Traceback (most recent call last)
<ipython-input-4-add074bebf92> in <module>()
     10 for i in range(nrows):
     11     for j in range(ncols):
---> 12         grid = make_ca(rules[i, j], init, niter)
     13         plot_grid(rules[i, j], grid, ax=axes[i,j])
     14 plt.tight_layout()

NameError: name 'make_ca' is not defined
