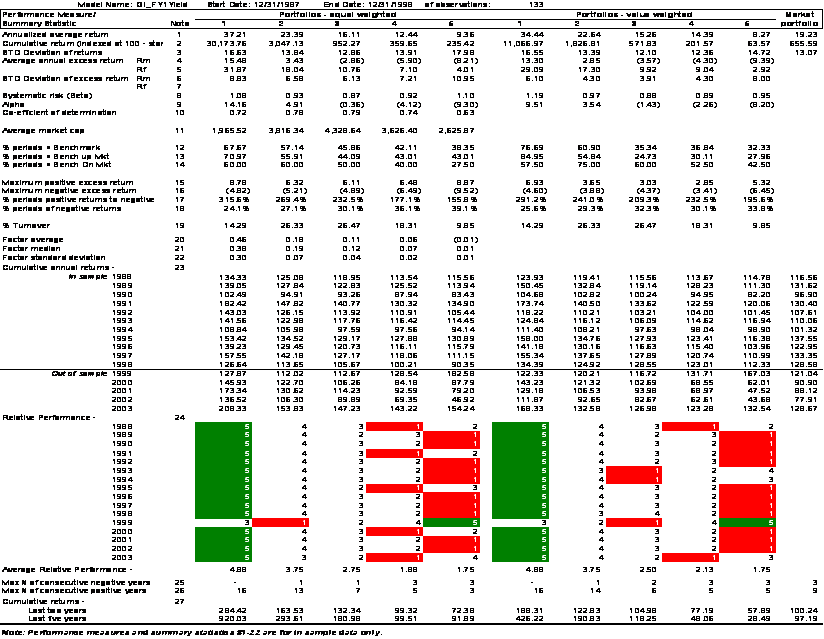
6: FY1 Yield
Description of Factor:
The forward
twelve month estimated EPS divided by closing market price. The rationale behind this factor is the
expectation that stocks with high expected value will perform better than those
will low expected value. This factor is
similar to a P/E screen but it includes stocks that have zero or negative
earnings which P/E does not.
Analysis
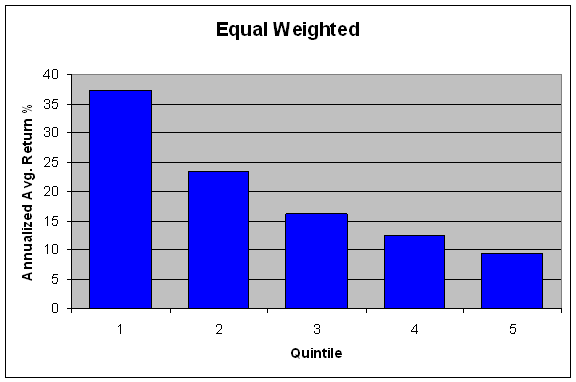
Equal
Weighted: This factor has strong
predictive powers for returns. The equal
weighted portfolios produce a clear step down pattern with an annualized
average return of 37.21% for quintile 1 and a 9.36% return for quintile 5. A long-short strategy based on this factor
would produce an annualized average return of 27.85%. The standard deviation for quintile 1 is
16.63, with a beta of 1.08 and an R2 of .72. The standard deviation for quintile 5 is
17.98, with a beta of 1.10 and an R2 of .63.
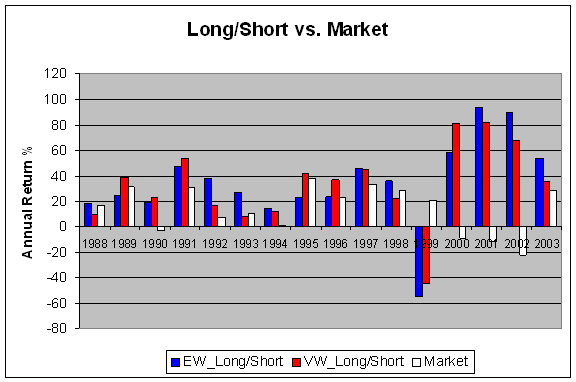
Except for
1999, the quintile 1 has the highest returns, and most years the quintile 2 has
the second highest returns. The quintile
5 does not consistently have the lowest returns, but except for 1999 the
returns are lower than quintile one. A
long short strategy would work very well using the equal weighted quintile,
even earning very positive returns when the benchmark market is negative.
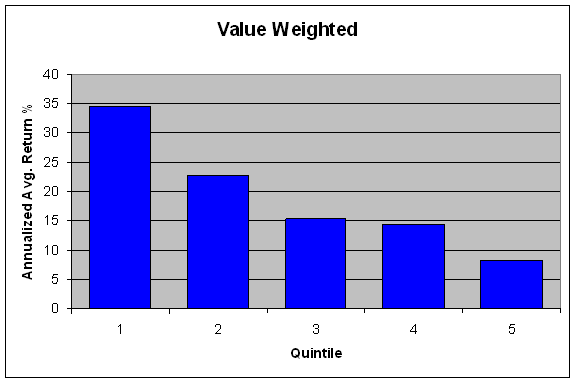
Value
Weighted: The value weighted
portfolios also follow a nice step distribution of returns from quintile 1 down
to quintile 5. The statistical analysis
is similar to the equal weighted, with the most significant difference being in
a lower standard deviation of quintile 5 in the value weighted. The primary effect of this is a lower
variation in the quintile 5, with it having the lowest returns most of the
years.
The value
weighted portfolios give in a clear step down pattern with an annualized
average return of 34.44% for quintile 1 and 8.27% return for quintile 5. A
long-short strategy based on this factor would produce an annualized average
return of 27.85%. The standard deviation
for quintile 1 is 16.55, with a beta of 1.19.
The standard deviation for quintile 5 is 14.72, with a beta of .95.
Conclusion:
Based on the analysis above, FY1 Yield is
a strong candidate for creating a long-short trading strategy. It is a good indicator of growth and in most
years has a good differential in returns between quintile 1 and quintile
5. Since the turnover of the portfolios
is moderate, executing a trading strategy on this factor would not result in
high transaction costs.