Dividend Yield
Rationale for Factor
Dividend yield, which reflects a company's prior year dividends divided by its current stock price, is a common measure of valuation. Thus, it was an obvious candidate for our model.
The data suggests going long the basket of highest dividend yield companies and shorting the basket of stocks with the lowest or no dividend yield.
Rationale against Factor
Sector bias is one potential criticism of the dividend yield factor. Selecting just the highest yielding stocks can produce a portfolio heavily biased towards utility, energy or financial stocks (all traditionally higher dividend paying industries) and biased against tech and consumer discretionary stocks (low dividend paying industries). A better solution could be selecting the highest dividend yields in each industry.
Second, dividend yield favors value companies over growth companies. Traditionally, well-established companies tend to pay higher dividends than younger, more growth oriented companies. Thus, the higher dividend yield fractile is likely to be composed primarily of value rather than growth companies.
Finally, dividend yield is a backward looking factor, as it is calculated using the prior year's dividend payout. A forward dividend yield or growth adjusted yield could be potential solutions to this critique.
Performance of Factor
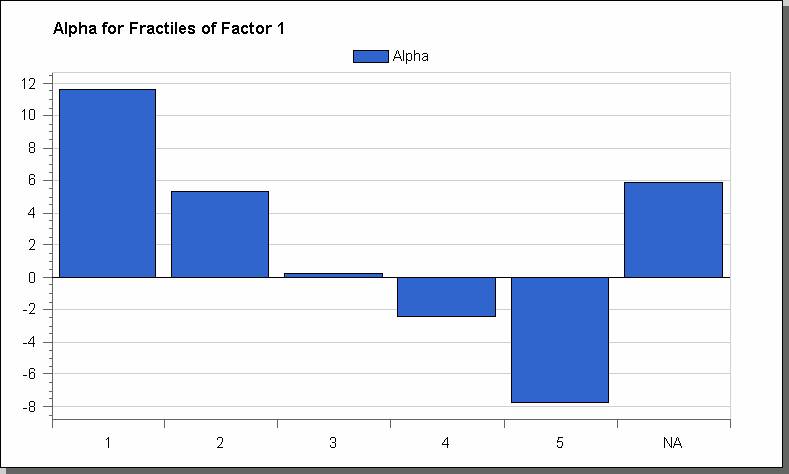
The results of the beta neutral long/short strategy were quite amazing. The average return since 1985 was 17% with a range of -26% to +38% and the Sharpe ratio was incredibly high at 1.11. The alpha spread was truly impressive, with the long fractile yielding +12% and the short fractile yielding -8%. Finally, turnover was, by far, the lowest for this factor, thereby reducing expected transaction costs.
As expected, the strategy did very poorly during the 1998 to 1999 period posting consecutive losses of -8% and -26%, respectively. That said, those were the only two years the strategy produced consecutive losses.
Additionally, the dividend yield strategy was remarkably consistent in terms of relative fractile performance. In every year but 1998, 1999 and 2003 the first fractile was the best performer. The worst performing fractile was slightly less consistent, but in nearly every year (except those just mentioned) either fractile 4 or 5 performed worst.
Conclusion
Dividend yield was our best performing univariate factor in terms of average returns, alpha, sharpe ratio and turnover. However, given the strong sector biases of dividend yield, the strategy may be implemented in conjunction with other factors.
Average Returns

Alpha

Beta


