Earnings Yield (FY2)
Rationale for Factor
The FY2 earnings yield for a company reflects earnings expectations two years out relative to its current stock price. Not only is E/P (or P/E) a common barometer of valuation, it also allows us to incorporate profitability expectations into our screen. Since the market is also forward looking, this factor is a logical candidate for our model.
As with Book to Price, the data suggests going long the basket of highest E/P ratio companies (or lowest P/E) and shorting the basket of lowest E/P stocks.
Rationale against Factor
On the other hand, a plain E/P ratio is not adjusted for the expected growth of earnings over time. Naturally, companies with high growth prospects generally trade at premium multiples to low growth companies.
Additionally, reported earnings may not be a great measure of the intrinsic value or growth in value of a firm. In short, free cash flows or similar cash flow expectations may be better indicators. Unfortunately, these metrics have not been historically tracked over time (particularly there expectations).
Finally, companies may manipulate earnings per share to smooth results or to meet Street expectations.
Performance of Factor
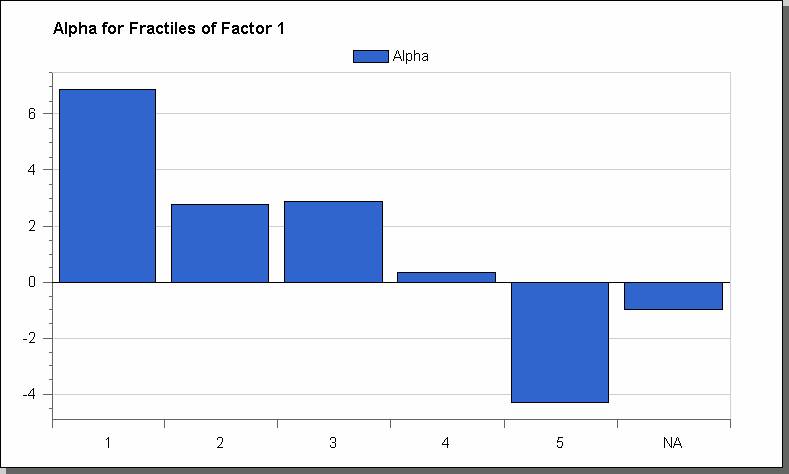
Again, the results of the beta neutral long/short strategy were amazingly good based on a forward earnings yield screen. The average return since 1985 was 10% with a range of -30% to +35%. The .55 Sharpe ratio was also very high despite the highest standard deviation in the group.
As expected, the strategy did very poorly during the 1998 to 1999 period posting consecutive losses of -19% and -30%, respectively. That said, those were the only two years the strategy produced consecutive losses.
Conclusion
Overall, we were very pleased with the FY2 Earnings Yield screen. Since it incorporates both valuation and forward looking expectations, we were not surprised that it was one of our better performing factors.
Given its vulnerabilities during the Internet bubble, however, the strategy may be best combined with other factors.
Average Returns

Alpha
Beta
