Earnings Growth
Rationale for Factor
We chose earnings growth (expected mean annual FY2 EPS expected mean annual FY1 EPS) in order to incorporate another forward looking factor into our analysis. Since the market is also forward looking we felt that this was a good candidate. This factor assesses the mean analyst expectation for earnings growth in the near-term.
Rationale against Factor
Some arguments could be made against using earnings growth as a metric including the fact that it is based on analyst estimates rather than on the market. Said another way, this factor is determined by the perceptions of a select few rather than derived from some security being traded in the market. Additionally, earnings growth doesn't necessarily suggest anything about the firm's current valuation.
Performance of Factor
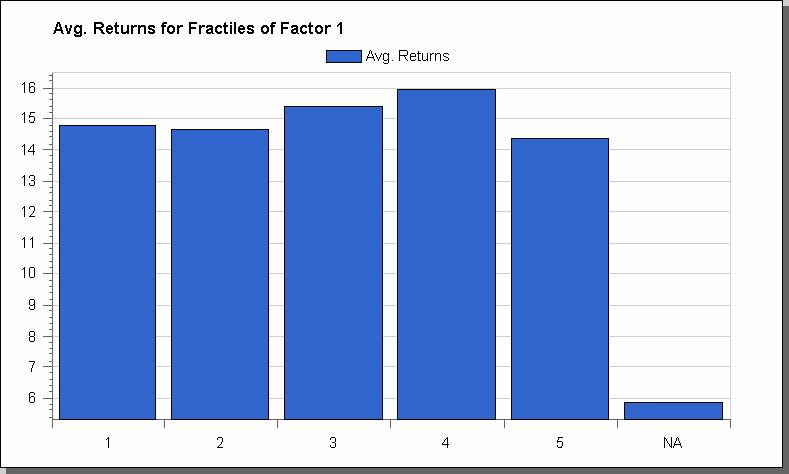
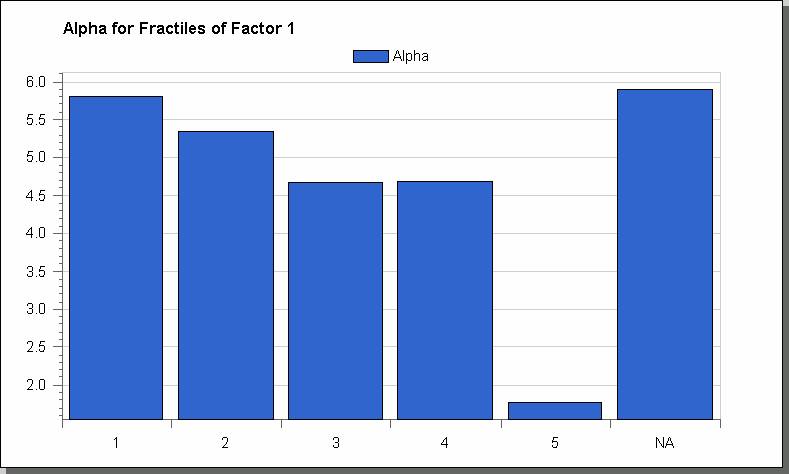
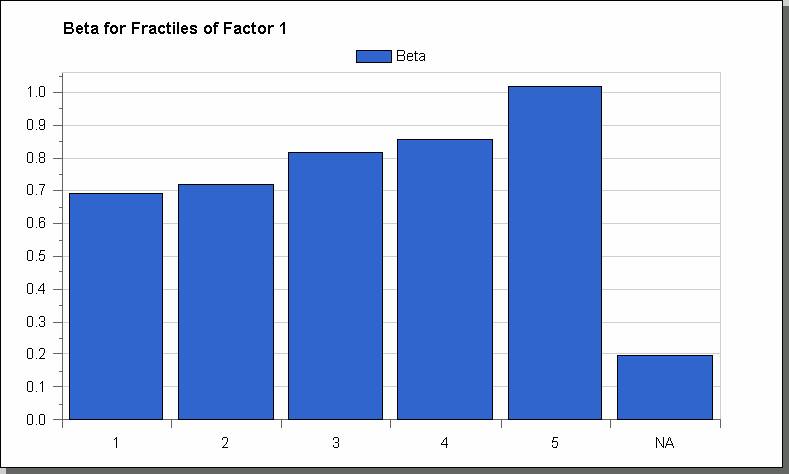
A beta neutral long/short screen produced relatively good results. The average annual return of 5.5% and .50 Sharpe ratio were certainly adequate, though not as compelling as some of our other screens. The range of returns (-23% and +22%) produced one of the lowest standard deviations of our analysis (11%).
Moreover the -23% return was hit during 1999, with the next lowest return being only -5% (so 1999 was an outlier). Overall the strategy only produced negative returns in six out of 20 years, and the negative years were not significantly negative. Along those same lines, a heat map suggests bucket performance is not very consistent.
Conclusion
While this strategy certainly produces some attractive results (on average), its inconsistency prevents it from being a serious candidate. The results are interesting though, suggesting that stocks with high growth prospects are often over-valued
Average Returns

Alpha

Beta


