Data visualization for research and teaching
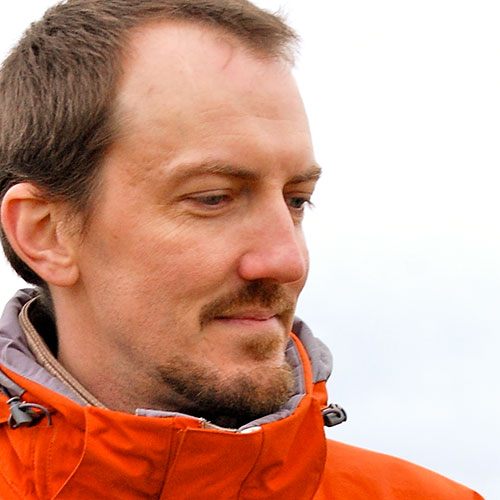
I am a Research Scientist at Duke University working on data visualization, organization, and processing, and on teaching others those skills so they can incorporate them into their research. My background is in the experimental sciences, where a PhD in Applied Physics led me to work on fluorescence microscopy, chemical nanosensors, and neuron-glial brain cell signaling. Since getting my current position in 2007, I have worked with many faculty and graduate students at Duke, from Math to Art History, helping them visualize and understand their data.
I know from experience that academics are trained in a specialized research area, and then their careers depend on their ability to effectively communicate their findings even though they're never trained in visual communication. That is why I am passionate about helping teach others, through workshops, feedback sessions, one-on-one consulting, and co-organizing a long-running and popular weekly talk series, the Visualization Friday Forum, for the past three years with my colleague Angela Zoss from Duke’s Data and Visualization Services.
My research projects, most of which are briefly summarized on the Projects page of this site, have included a ten-year collaboration over many topics with Mauro Maggioni from Math. Since 2010, I have been also been working closely with many faculty and students from Duke's department of Art, Art History and Visual Studies, helping them incorporate technology and visualization into their humanistic scholarship, and I find that process very rewarding. Maybe most importantly, my research projects have provided me with deep hands-on experience that I can draw from to help other solve their problems.
Please peruse my portfolio of research projects on the next page, take a look at my CV, browse my code repository on github, or enjoy my (non-academic) portfolio of photographs.