|
|
|
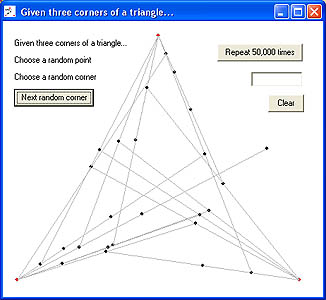
The Chaos Game - Half-Way There
These simulations are variations on a single theme. The theme is illustrated by an apocryphal story:
Once upon a time there was an indecisive
nomadic family. They were always looking for a better life and set out
to make their fortune in a surrounding city. You can left-click on
the screen to set the location of several, but
try beginning with just three. You can then right-click on the screen
to set the location of that family's first camp. The family then follows
a compulsive and seemingly random behavior: It picks one city at random
and travels towards it. After travelling half-way there, it grows tired, stops
and camps for the night. In the morning the family awakes, and being indecisive,
selects another city as its goal. It travels half-way there and camps.
Compulsively, it selects a city at random, travels half-way
there, and camps for the night.
An archaeologist might ask, "Is there any pattern
to the abandoned campsites?"
I'll ask you that question...
There is a way to reason your way to an answer, but I've never met anyone who
could could do it. |
|
Half Way There - A Simple Demonstration Version
- 2007
A somewhat bare-bones version used to demonstrate
the problem without necessarily revealing its solution.
|
Chaos Game sampling a range of distances expanded to 1000 x 1000 pixels with modifications...
     |
|
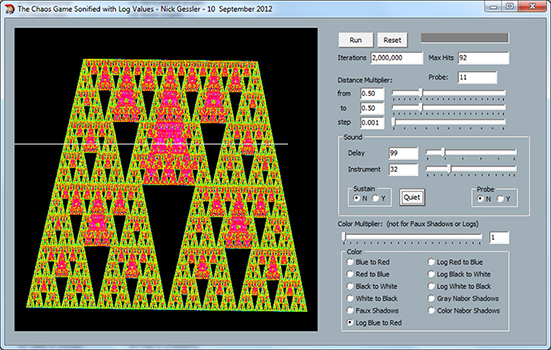
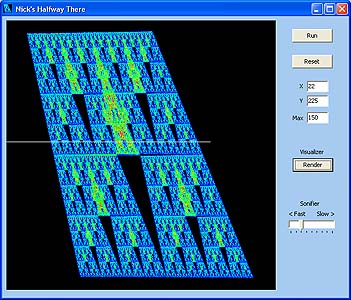
Chaos Game - Sonified September 2012
Sonification has been added to the January version below. A choice of instruments and achoice of delay has been added as well as the choice of sustaining or silencing each note. All unsilenced notes may be quieted with the button of that name. Notes will not repeat adding to variation in the rhythm. Notes followed by black will sustain. The option of sound has also been added to the probe but it must be moved slowly and carefully to play notes distinctly.
To do:
Sustain repeated notes into the silent interval.
Allow two or more tracks to run with different instruments and/or at a higher or lower register.
|
|
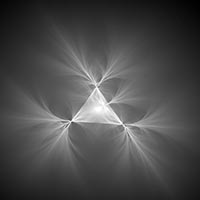
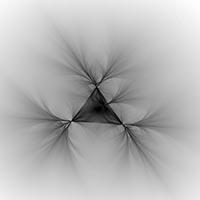
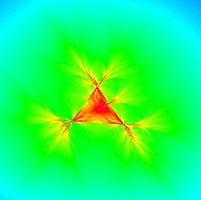
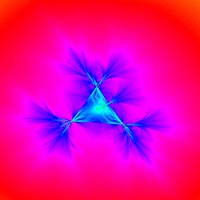
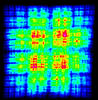
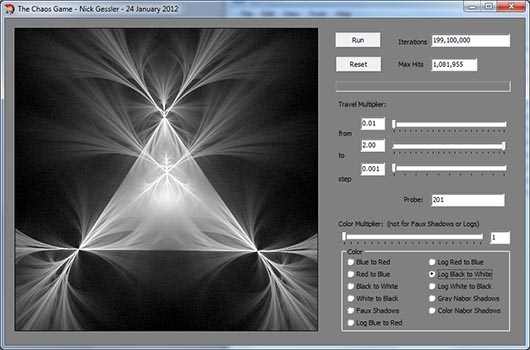
Chaos Game - 25 January 2012
The canonical algorithm has been changed so that the distance travelled can be selected as a multiplier between 0.01 and 2.00. The distance travelled may also be automatically varied between those points. The data generated creates patterns over a wide dynamic range of values, making visualization difficult. Several rendering schemes have been included with mixed results.
|
Chaos Game in 3D Anaglyphs (Red/Cyan) |
|
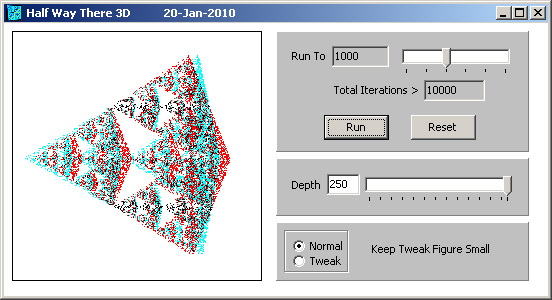
Half Way There - 3D -int world[400][400][400] - January 2010
A 3D anaglyph requiring red/cyan glasses. The world is 400 cubed, a Boolean array, containing 64,000,000 cells and occupying 64,000,000 bytes of memory. In placing points (cities) on the map, use the TrackBar to give the location depth. A depth of 0 pops out at you; a depth of 400 is behind the plane of the display. The configuration of points (cities) can be written to and read from a text (.txt) file with the Open and Save buttons. When selecting the tweaked version of the code, please make sure to keep the distribution of cities relatively small. Otherwise the points may grow out-of-bounds and crash the application. At the end of each Run, the total number of cells occupied in the world is given, as well as the percentage. The Red/Cyan color separation can also be adjusted to control the perception of depth.
To create the 3D anaglyph, the three-dimensional world is read and the points (cities) projected onto a two-dimensional plane. The X and Y positions in the 3D world are mapped to their same positions on the 2D plane and colored RED. The X position in the 3D world is then shifted horizontally in proportion to its depth (the Z dimension) and then mapped, along with its unaltered Y position, on the 2D plane and colored CYAN. If the cell in the 2D plane was already RED, the position is then colored BLACK.
|
|
Half Way There - 3D - int world[250][250][250] - January 2010
A 3D anaglyph requiring red/cyan glasses. In placing cities on the map, use the TrackBar to give the point depth. A depth of 0 pops out at you; a depth of 200 is in the plane of the display. When selecting the tweaked version, please make sure to keep the distribution of cities relatively small. Otherwise the points may grow out-of-bounds and crash the application. The world is 250 cubed, an Integer array, containing 15,625,000 cells. Interestingly, the RGB Color Cube is 256 cubed, containing 16,777,216 colors.
|
Chaos Game - More Examples of Visualizing and Sonifying the Hidden Information. |
|
|
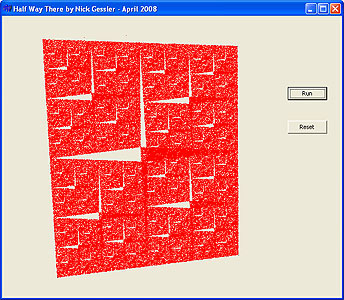
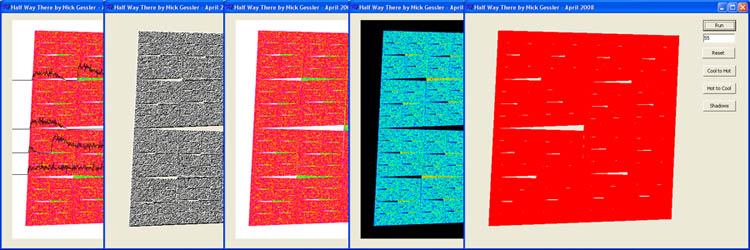
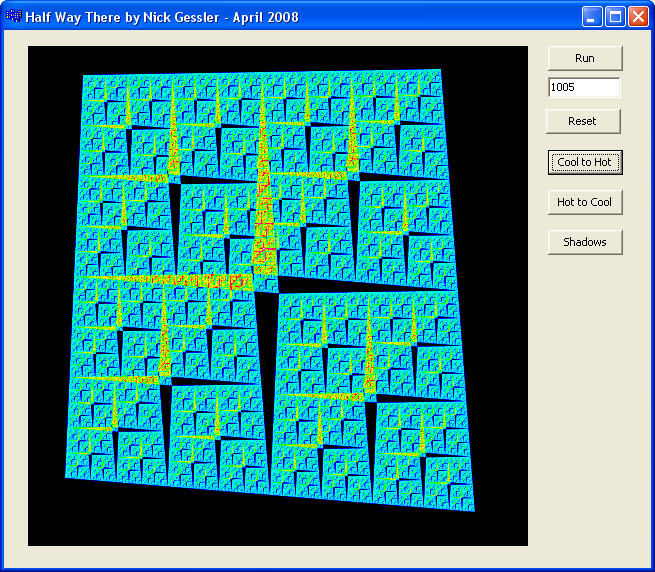
Half Way There - April 2008 "C"
Some enhancements we may make on the second day
of class.
Full-Size Screen
Shots (the pattern clarifies after 1000 hits): cold-to-hot / hot-to-cold / faux-shadows
|
|
|
Half Way There - April 2008 "B"
As far as we got on the first day of class. We'll
be enhancing this...
|
|
|
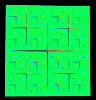
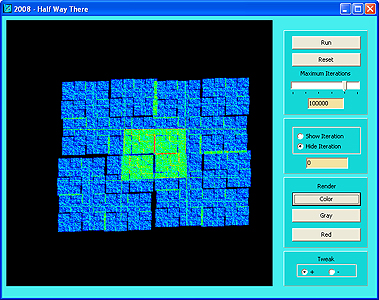
Half Way There - January 2008
Getting a bit fancy... Introducing Buttons, TrackBars,
Edit, Panels, RadioGroups and PaintBox. Sleep has been changed to Maximum
Iterations. There is a choice of displaying the iterations or not and
a choice of tweak or not. The array may be rendered in three ways. The
image to the left shows both the normal (+) version and the tweaked (-)
version. The tweaked (-) version is run ten times (10x) more than the
normal version to provide comparable shading.
Playing with this, I did enter a configuration of dots which produced a fractal spiral pattern. However, I do not remember what that initial pattern was. Please let me know if you find it. |
|
|
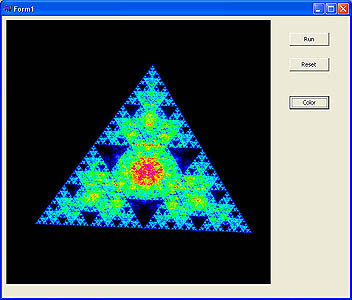
Half Way - Start - What we did in
class April 5, 2007
Not too fancy, but we added color visualization to
the rendering. For this image, a dot was placed at each vertex of a triangle
and one in the center. Later, three more dots were added to the center
of each of the three large inverted black triangles.
|
|
|
Half Way There - Sonified
A modification in which the RENDER function automatically
scales the color ramp to accommodate the full range of the data. The display
is also sonified. By right clicking on any row of the image, that row
will be scanned and the data values automatically scaled to accommodate
the full range of the MIDI keyboard. The speed of the scan, and thus the
speed of the sonification, are user adjustable. The cursor position and
the maximum value of the array (used for automatic scaling) are also shown.
|
Chaos Game "bent" algorithm ("+" to "-" switch) expanded to 1000 x 1000 pixels run to 4 billion iterations with modifications...
     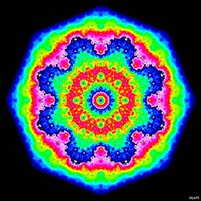 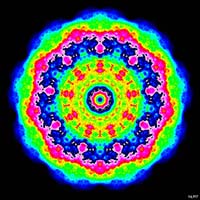 |
Intricate patterns in the cloud of points are more clearly resolved by increasing the number of iterations. Click on any image for the full scale screen capture.
In these images, the gray scale is applied only from the minimum number of hits per pixel to the maximum number of hits per pixel.
|
|
Halfway There (Bent January 2009)
The original version ran only 1 million iterations. This version runs 10 million iterations by default although you can choose to run as many as 100 million or as few as the the original 1 million. Increasing the number of iterations makes the cloud of points develops the intricate patterns more clearly. Clicking on any image will call up a full scale image. In the image to the left the grayscale is applied four times, once to each 25% of the entire range from the minimum number of hits per pixel to the maximum number of hits per pixel.
|
|
|
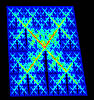
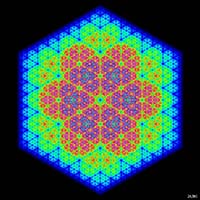
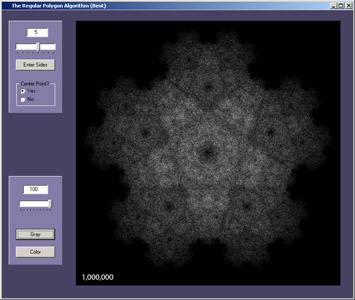
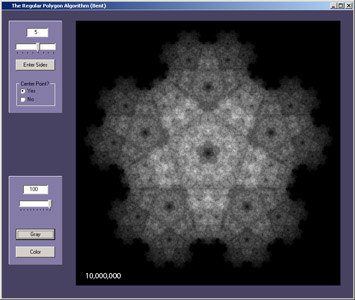
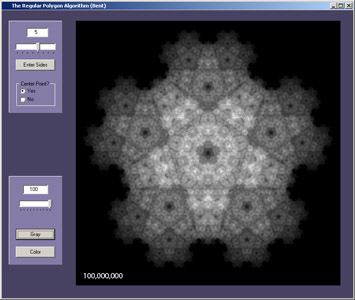
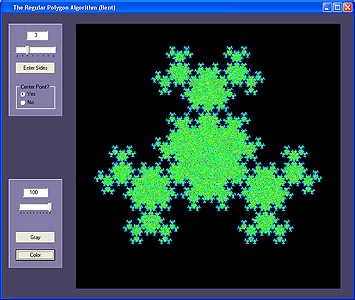
Regular Polygons (Bent)
Here we bent the rules, following a suggestion in
class to change the "-"s in the algorithm to "+"s.
Additionally, we included the option of an extra point at the center of
the polygon, suggested by a "bug" in the "user defined
polygons" applications below. This now produces quite a variety of
fractal images.
|
|
|
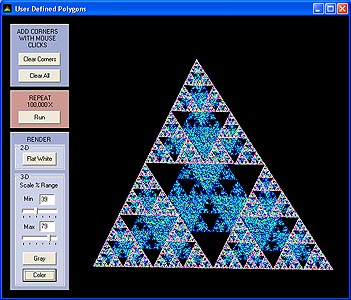
User Defined Polygons
A further modification allowing the user to define
the shape of the polygon.
|
|
|
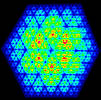
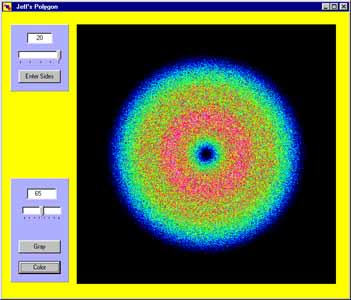
Jeff's Polygon
A modification of the application above by Jeff Shih
who extended the process to polygons of many sides, by Dave Niebuhr who
helped debug it, and by Nick Gessler who added the coloring algorithms.
A slider bar allows you to enhance the detail of the algorithm.
|
Mandelbrot Set:
From Wikipedia,
the free encyclopedia: Work on the Mandelbrot set "coincided with
a huge increase in interest in complex dynamics, and the study of the
Mandelbrot set has been a centerpiece of this field ever since. It would
be futile to attempt to make a list of all the mathematicians who have
contributed to our understanding of this set since then..." |
|
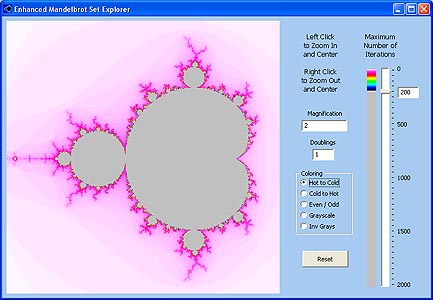
New Mandelbrot Explorer
enhanced from Jeff Suer's
This
application, contributed by Jeff Suer, allows the user to explore the
Mandelbrot set by zooming in from a magnification of 1 to a magnification
of 230 or over one billion power (1,073,741,824). That is
20 times the magnification of an electron microscope.
Zoom-and-Center, either
in and out is accomplished by clicking the left or right mouse button
respectively. Magnification and doublings (powers of 2) are shown in
Edit boxes with each click. The user may choose from 5 different coloring
schemes including a "contour" map based on coloring odds and
evens either black or white.
|
|
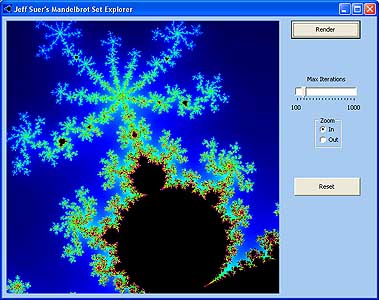
Jeff Suer's Mandelbrot
Explorer
This
application, contributed by Jeff Suer, allows the user to explore the
Mandelbrot set by zooming in from a magnification of 1 to a magnification
of 230 or over one billion power (1,073,741,824). That is
20 times the magnification of an electron microscope.
|
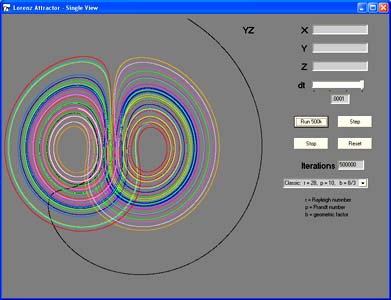
The Lorenz Attractor:
|
From Wikipedia,
the free encyclopedia: The Lorenz attractor is a chaotic map, noted for
its butterfly shape. The map shows how the state of a dynamical system
(the three variables of a three-dimensional system) evolves over time
in a complex, non-repeating pattern, often described as beautiful. The
attractor itself, and the equations from which it is derived, were introduced
by Edward Lorenz in 1963, who derived it from the simplified equations
of convection rolls arising in the equations of the atmosphere...
Also
see Andrew Ho's pages on chaos and the Lorenz
attractor... |
|
Lorenz Attractor -
3 views - Color and 3D Anaglyph
This application
shows all three 3-dimensional plane projections. The user may choose to color the points progressively from black,
through the cool and then warm colors, to white as the function is iterated, or choose to create a 3D anaglyph which requires red/cyan glasses to see. The red color is plotted as previously, but the cyan color is displaced to the right in proportion to the projection into the screen. The code was further modified to display white at any pixel where red was overlain by cyan or cyan was overlain by red. The image above is a composite of both visualization choices.
|
|
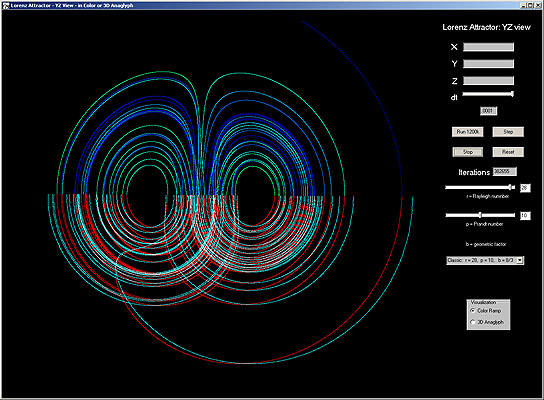
Lorenz Attractor -
1 view - Color
This application
shows only the YZ plane and colors the points from black, through the
cool and then warm colors, to white as the algorithm generates them
from the first to the last iteration. The added dimension of color shows
additional chaotic behavior that is obscured in a single color plot.
|
|
Lorenz Attractor -
1 view - Color and 3D Anaglyph - Large
This application
shows only the YZ plane and colors the points from black, through the
cool and then warm colors, to white as the algorithm generates them
from the first to the last iteration. The user may choose a color visualization to show
additional chaotic behavior that is obscured in a single color plot, or may choose a 3D anaglyph which requires red/cyan glasses to see. The red color is plotted as previously, but the cyan color is displaced to the right in proportion to the projection into the screen. The code was further modified to display white at any pixel where red was overlain by cyan or cyan was overlain by red. The image above is a composite of both visualization choices..
|
|


