|
Garmin GPS-12,
Waypoint Software and a Windows Application...
|
 xxx
xxx  |
|
| Connect the GPS-12
to your computer with the data cable. The round 4-pin connector goes in
the back of the Garmin. The "D-shaped" 9-pin connector goes in
the Com port of the PC. Turn your GPS unit "ON." |
Run the Waypoint
program. The main program window should appear. You can obtain your own
copy of the software for free from Waypoint. |
|
|
|
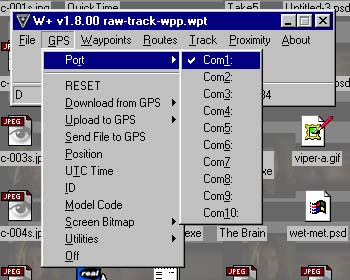
| Select the appropriate
Com port. Try Com1. |
Download the GPS
Track from your Garmin. |
|
|
|
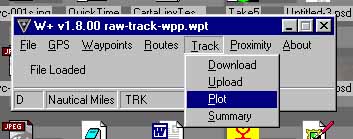
| Plot the Track using
the Waypoint software. |
Experiment with
the settings. Compose a nice visualization and print it out. |
|
|
|
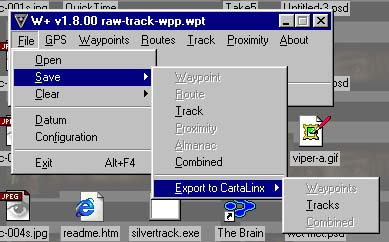
| Save the Track log
by exporting it in CartaLinx format. Name it something distinctive like
CartaLinx-Track-Coyote. It will be a simple ASCII text file. |
Open the file in
Notepad ASCII text editor to see what it looks like. Notepad does not provide
you with many editing tools. |
|
|
|
| Open the file in
Word in plain-text encoding to see what it looks like. Word provides you
with more editing tools than Notepad, but it has limited use in changing
file formats. |
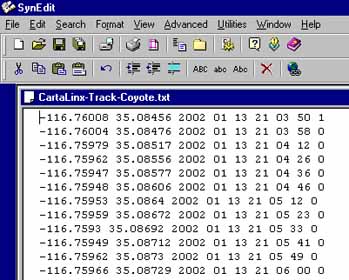
Open the file in
SynEdit. SynEdit is designed to make it easy to ascertain and change file
formats. Notice that it does provide you with a line count, in this instance
1023. |
|
|
|
| Replace the comas,
slashes, and colons with blanks. Do an "entire file" find and
replace on each of the three marks. Your file should look like this when
finished. "Save As" the file with a new name, you might add the
designation "-clean" before the dot. |
Remember how many
records there were? Insert this number at the beginning of the file and
save it. That way our program will know how many records to read. You have
now created a customized file format. |
xxx

|
|
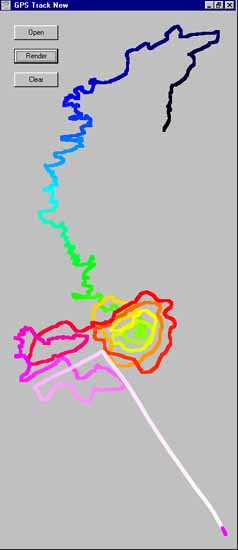
Something's
wrong with the color!
The
first version of the "GPS Track New" application run on the
Coyote Dry Lake dataset. In reality, the track begins in the North and
ends in the South. Why does the coloring show the track beginning in
the middle and moving South, then a huge gap in color as well as in
time, culminating with the track beginning in the North and moving to
the middle? The answer is that the black/white transition point represents
midnight Greenwish Mean Time and consequently a new day. The first version
of this application ignores the day and interprets the data as an early
morning track, a long siesta, and a late evening track.x
|
The
color looks OK!
The
second version of the "GPS Track New" application run on the
Coyote Dry Lake dataset. The application has been changed so that the
day is not ignored. All the times, including the day, are recalculated
as seconds. The minSec value had to be increased to 10,000,000. The
value of days*86400 had to be added to the seconds counter. The problem
will reoccur on the last day of the month.
Any number of files can be reopened
and the Window will resize itself to accommodate the data.
|
|
|
Point the GPS Track New application
at your data file. It should render your data recognizably well. You
will probably have to resize your Window.
You will find the application on
the Simulations Page
GPS
Tracking
|
|
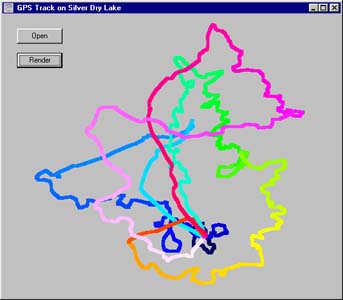
The
color looks OK!
The first version of the "GPS
Track New" application run on the Silver Dry Lake dataset. The track
was run in the late afternoon so the software "bug" was not
apparent.
|
 xxx
xxx 

