3D Anaglyphs - Borland C++ Builder 6 Applications Best viewed with RED / CYAN glasses. |
|||
| 3D Journal | |||
|
Evolutionary Computing - The Traveling Ferenghi Problem Your are given the task of visiting up to 30 cities. Having limited time and resources, you want to make the trip in as short a distance as possible, returning home when you are finished. Consequently, you must visit every city, and each city only once. Evolution, "the blind watchmaker," generally finds reasonably good solutions in seconds. More complex rules may be found on our "Evolution" page. This version was simplified in order to explore 3D rendering. |
|||
 |
Evolutionary Concert Tour (ECT)
with 3D Anaglyph Enhancement The "Yours" city placement button allows you to choose the "z" component before you MouseDown on the PaintBox. Once you click this button, a SetFocus() command returns focus to the "z" TrackBar which allows you to either move the cursor with the wheel or to move the cursor with the mouse. The detents on the wheel have a value of 1 (on my mouse). It is possible to draw points which progressively sink into, or out of, the screen by rolling the mouse wheel about 3 detents between MouseDowns. (Thirty points at three detents each give a total depth of about 90.) To correctly color an anaglyph, when cyan overlays red the result should be rendered in black on a white background. Or rendered in white on a black background. This could be done by drawing the cyan and red lines as points onto another array where each cell can be checked for that overlay and red or cyan, black or white, entered depending on the previous value. Reducing the lines to points in order to accomplish this would require substantial modification. Consequently, this version uses PaintBox->LineTo() commands which draw red lines over the top of cyan lines and cyan lines over the top of red lines instead of combining them to yield black or white. As a result of this heuristic, lines with little separation, specifically horizontal lines, will appear anomalous. The user may also select the background. Note that with a white background, the rendering appears below the screen while with a black background the rendering is reversed and appears above the screen. |
||
|
|||
Half Way There a.k.a. The Chaos Game Once upon a time there was an indecisive nomadic family. They were always looking for a better life and set out to make their fortune in surrounding cities. The user can left-click on the screen to set the location of each many cities, but try beginning with just three. The user can then right-click on the screen to set the location of that family's first camp. The family then follows a compulsive and seemingly random behavior: It picks one city at random and travels towards it. When it is half-way there it tires, stops and camps for the night. In the morning the family awakes, and being indecisive, selects another city as its goal. It travels half-way there and camps. Compulsively, it keeps selecting a city at random, travelling half-way there, and camping for the night. The question: |
|||
|
|
Half Way There - 3D -int world[400][400][400] - January 2010 To create the 3D anaglyph, the three-dimensional world is read and the points (cities) projected onto a two-dimensional plane. The X and Y positions in the 3D world are mapped to their same positions on the 2D plane and colored RED. The X position in the 3D world is then shifted horizontally in proportion to its depth (the Z dimension) and then mapped, along with its unaltered Y position, on the 2D plane and colored CYAN. If the cell in the 2D plane was already RED, the position is then colored BLACK.
|
||
The Lorenz Attractor: |
|||
 |
Lorenz Attractor -
3 views - Color and 3D Anaglyph |
||
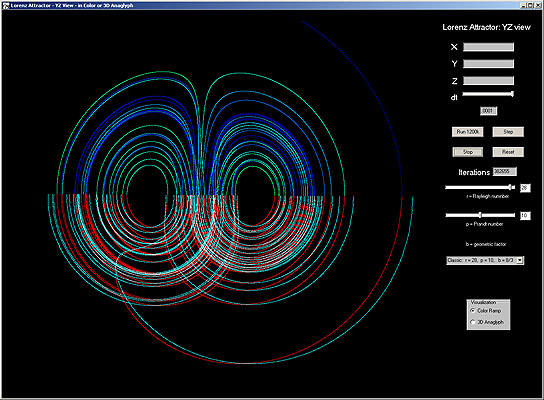 |
Lorenz Attractor -
1 view - Color and 3D Anaglyph - Large
|
||
3D Photography Several 3D cameras have been commercially marketed over the years. Many are now collector's items. However, any camera will work and with PhotoShop you can make your own 3D anaglyphs. For depth as the eye would see it, simply take two photographs from the point of view of each eye (two photos about 2.5" apart). This gives good depth to objects up to a distance of about ten feet. For more distant scenes, take one photo and then step sideways and take another. For panoramic outdoor shots (mountains, canyons, beaches) take two photos several steps apart. |
|||
|
|
|
||
|
|
|||
 xxx
xxx xxx
xxx xxx
xxx xxx
xxx


