Rob Schick |
Statement of research | |||
| home | cv | research | photos | links |
UW to Duke to New England Aquarium to NOAA Fisheries back to Duke again In the early 1990s I did a lot of field work studying humpback whales in Maui and in Australia. While my training was pretty limited at the point, I was always curious about the distribution of organisms. This was especially acute when I would participate in aerial surveys. Why would organisms be in one place on one day, and a completely different place on the next day? What caused their movement? How did they perceive their environment? And how could we efficiently monitor their distribution? This stuck with me until about 1996 when I first learned about GIS at a local science and management conference in Seattle, where researchers from the Pacific Biodiversity Institute presented an overview of GIS in terrestrial conservation. I was blown away by its potential, by its ability to efficiently manage data, and by its unique ability to find and monitor spatial relationships. With that in mind I pursued a Masters degree at Duke, where I worked closely with Pat Halpin and with Dean Urban, my advisor. While being exposed to fundamental GIS and spatial analysis techniques, I was working on a paper that examined the distribution of bowhead whales around oil drilling platforms (Schick and Urban, 2000 PDF). This training led me to a job at the New England Aquarium, where I was hired to set up a marine GIS lab and embark on a research program into the distribution of right whales and bluefin tuna. The work with right whales is still ongoing, as I am currently developing a Bayesian State-Space Model to examine their movement. Molly Lutcavage and I were able to analyze bluefin tuna data in relation to sea surface temperature fronts (Schick et al., 2004. PDF) and this work was mentioned in Science (PDF) later that year. In 2002 I left NEAq to work at NOAA Fisheries in Santa Cruz, CA as a GIS analyst/researcher. Starting in 2003, I managed a GIS lab that was responsible for, among other things, building a habitat model for three different endangered fish species in every anadromous river and stream reach of California. This was quite an undertaking, and it formed the basis of much of the lab's research efforts into the historical population structure of endangered salmonids throughout California. My time at NOAA was extremely rewarding, but I decided to head back to Duke to pursue my Ph.D in Ecology. My experience to date has distilled my interests into three components of spatial ecology, which I intend to explore in my PhD: movement, connectivity, and the role of environmental stochasticity. Movement is intrinsically linked to connectivity, as dispersal at multiple spatial and temporal scales drives population connectivity. Yet despite the recent explosion of the science of networks, relatively little attention has been focused on connectivity in ecological networks (aside from food webs - though this is changing). I am interested in exploring connectivity at different ecological scales, because this evolving science offers a mathematically rigorous way to test for population structure, persistence, and vulnerability. Finally, I am interested in seeing how movement and connectivity interact with the environment to determine if some underlying principles can be learned about the role of space, the environment, and the organism in a variety of ecosystems (freshwater and marine). Please see my cv for a full list of publications and presentations. A graph-theoretic approach for spatial structure of riverine fish populations Currently I am working on a model with Steve Lindley from NOAA Fisheries that assesses the historical structure of spring-run chinook salmon in the Central Valley of California. We have used a graph theoretic approach to understand what the historical structure was, how that structure and function changed with the addition of large water storage dams, and how an understanding of that structure influences conservation, management and restoration decisions about the current (compromised) suite of populations. Interested? Come see my talk at ESA (Thursday, August 10, 8-11:30 am). An image of that work is below. 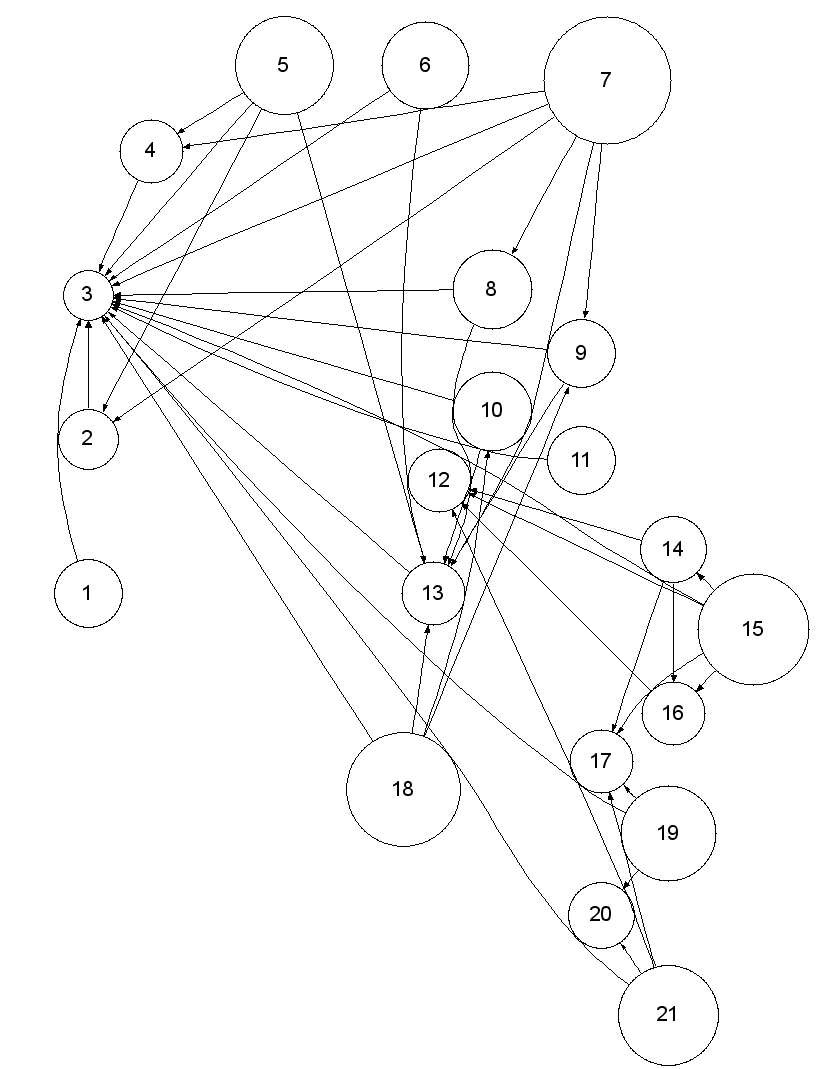 Figure Digraph for dispersal through the historical spring-run Chinook salmon Evolutionarily Significant Unit. Populations are connected if donor population contributes more than 1% of local recruitment to the receiving population. The size of the nodes corresponds to the amount of habitat present in each watershed (log + 1.5 transformed), and the location of the nodes in the figure is an approximation of their true location. | ||||
| Webpage updated: 07/2006 by rob schick Questions? Ping me. | ||||