 Data concepts
Principles and risks
of forecasting (pdf)
Famous
forecasting quotes
How to move data around
Get to know your data
Inflation adjustment
(deflation)
Seasonal adjustment
Stationarity and differencing
The logarithm transformation
Inflation adjustment
Inflation
adjustment,
or "deflation", is accomplished by dividing a monetary time series
by a price index, such as the Consumer Price Index (CPI). The
deflated series is then said to be measured in "constant dollars,"
whereas the original series was measured in "nominal dollars" or
"current dollars." Inflation is often a significant component of
apparent growth in any series measured in dollars (or yen, euros, pesos, etc.).
By adjusting for inflation, you uncover the real growth, if any.
You also may stabilize the variance of random or seasonal fluctuations and/or
highlight cyclical patterns in the data. Inflation-adjustment is not
always necessary when dealing with monetary variables--sometimes it is simpler
to forecast the data in nominal terms or to use a logarithm
transformation for stabilizing the variance--but it is an important tool in the
toolkit for analyzing economic data.
The Consumer
Price Index is probably the best known US price index, but other price indices
may be appropriate for some data. The Producer Price Index and the GDP
Implicit Price Deflator are some other commonly used indices, and numerous
industry-specific indices are also available. The U.S. Bureau of Economic
Analysis compiles a wide array of "chain-type" price indices for
various kinds of personal consumption goods. A chain-type index is one
that is obtained by chaining together monthly, quarterly, or annual changes in
relative prices that are adjusted for changes in the composition of the
commodity basket, so as to reflect changes in consumer tastes. (For more
details on chain-type indices, see the following article.)
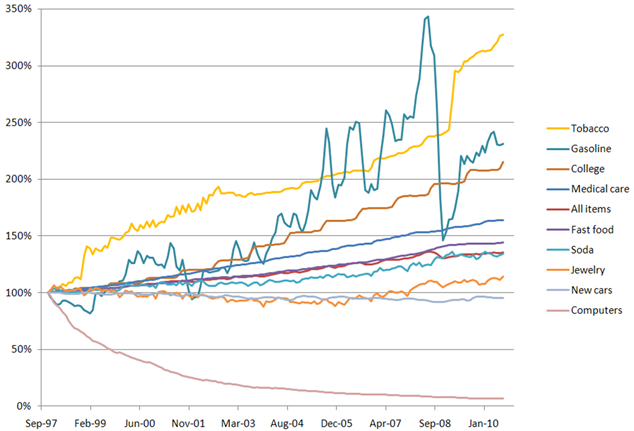
The
following chart shows price indices for a variety of products and services over
the period from 1997 to 2010, all scaled to a value of 100% in 1997. There are some striking
differences: the price of
gasoline has experienced large downward as well as upward movements due to
shocks to the world economy, tobacco prices have risen in large part due to taxation,
the price of a college education has gone up dramatically in stair-step
fashion, and the price of computers has shown an exponential decline rather than exponential
growth. (The ordering of the series
in the legend is the same as their rankings in 2010, except that the all-items
index should be ranked below rather than above fast food.)
Use of an
appropriate price index is important if you are interested in knowing the true
magnitudes of trends in real terms
and/or if the relevant price history has undergone sudden jumps or significant
changes in trend rather than consistent increases over time.
However, deflation by a general-purpose index such as the CPI is often adequate
for rough estimates of trends in real terms when doing exploratory data
analysis or when fitting a forecasting model that adapts to changing trends
anyway. Keep in mind that when you deflate a sales or consumer
expenditures series by a general index such as the CPI, you are not necessarily
converting from dollars spent to units sold or consumed, rather, you are
converting from dollars spent on one type of good to equivalent quantities of other
consumer goods (e.g., hamburgers and hot dogs) that could have been
purchased with the same money. Sometimes this is of interest in its own
right because it reveals growth in relative terms, compared to prices of other
goods.
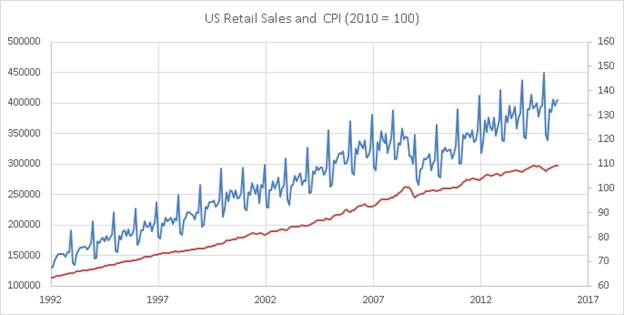
Here is the
graph of U.S. total retail sales in nominal dollars ($millions) plotted alongside the CPI for
the period from January 1992 to August 2015, where the CPI has been scaled
so that the average value in 2010 is 100:
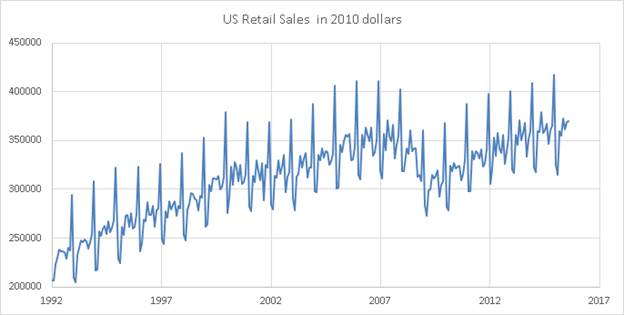
Next, here
is a graph of retail sales divided by (i.e. deflated by) the CPI. The trend that remains is real growth. The seasonal pattern and the magnitude
of the drop in sales during the Great Recession stand out more clearly when
displayed in real terms:
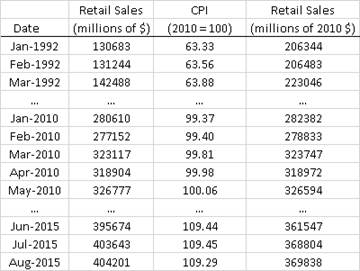
The
following screen shot of the spreadsheet shows how the process of adjusting the
retail sales to 2010 dollars was carried out here. The U.S. all-city-average CPI was
obtained from a public source (Economagic.com) and adjusted to 2010 dollars by
dividing it by the average 2010 value and then multiplying by 100. (It is conventional to scale it to a
value of 100 in the base year.) The
inflation-adjusted values were obtained by dividing the original sales values
by the 2010 CPI and then multiplying by 100. For example, 206344 = (130683/63.33)x100.
When looking
at descriptions of time series obtained from government or commercial data
sources, the identifier "$" or "dollars" means the series
is in nominal dollars (i.e., not inflation-adjusted). An
identifier such as "2010 dollars" or "2010 $" means that
the series is in constant (inflation-adjusted) dollars, with 2010 taken
as the reference point. For modeling purposes, the choice of a reference point
doesn't matter, since changing the reference point merely multiplies or divides
the whole series by a constant. To move the reference point to a different base
year, you would just divide the whole price index series by the current value
of the index at the desired reference date. However, the parameters of a model
are easier to interpret if the same reference point is used for all
inflation adjustments. The thing you wish to avoid at all costs is having some
variables which are inflation adjusted and others which aren't:
this will introduce apparent nonlinear relationships which are merely artifacts
of inconsistent units.
Finally, remember
that inflation adjustment is only appropriate for series which are measured in
units of money: if the series is measured in number of widgets produced or
hamburgers served or percent interest, it makes no sense to deflate. If a
non-monetary series nonetheless shows signs of exponential growth or increasing
variance, it may be useful to try a logarithm transformation
instead.
Go on to next topic: Seasonal adjustment