Using scipy statistics
In [1]:
%matplotlib inline
In [2]:
import numpy as np
import scipy.stats as stats
import matplotlib.pyplot as plt
In [3]:
np.set_printoptions(precision=3)
In [4]:
plt.style.use('seaborn-notebook')
Random number generators
Create a distribution object
In [5]:
d = stats.norm()
In [6]:
d.mean(), d.std(), d.var()
Out[6]:
(0.0, 1.0, 1.0)
Get random variables
Compare with rnorm in R
In [7]:
d.rvs(10)
Out[7]:
array([ 1.07 , -0.339, -0.282,  0.743,  0.14 ,  0.551, -1.779, -0.496,
        1.339, -2.516])
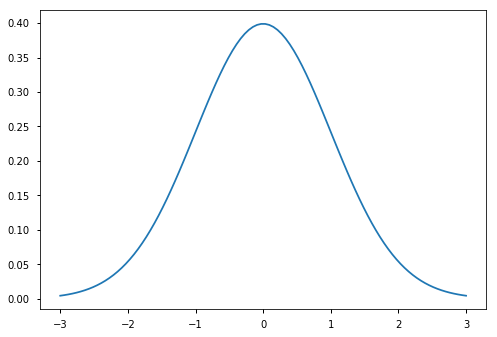
Get PDF
Compare with dnorm in R
In [8]:
x = np.linspace(-3,3,100)
In [9]:
y = d.pdf(x)
In [10]:
plt.plot(x, y)
pass

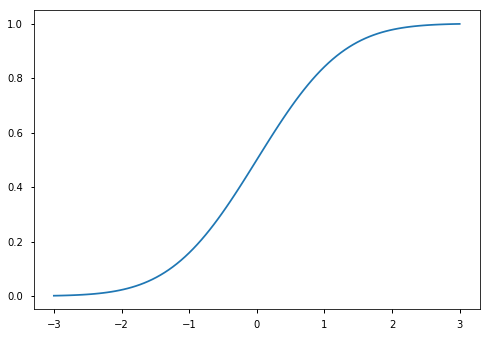
Get percentiles
Compare with qnorm in R. This is the inverse CDF function.
In [13]:
xp = d.ppf(y)
In [14]:
plt.plot(xp, y)
pass
Example
1. Assume IQ has a normal distribution. Suppose the average IQ of a Duke student is 130, with a standard deviation of 13.
- Make a plot of the distribution of IQs between 70 and 190.
In [15]:
d = stats.norm(loc=130, scale=13)
In [16]:
iqs = np.linspace(70, 190, 100)
In [17]:
plt.plot(iqs, d.pdf(iqs))
pass

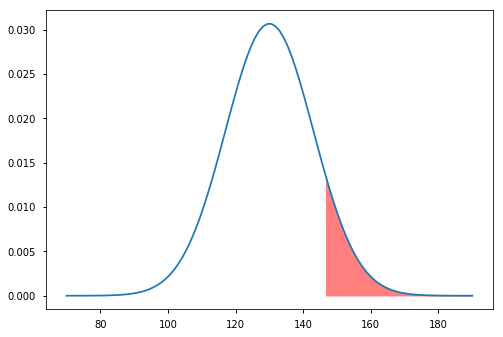
- What IQ do you need to be in the top 10 percentile?
In [18]:
d.ppf(0.9)
Out[18]:
146.6601703520798
In [32]:
xp = np.linspace(d.ppf(0.9), 190, 100)
y1 = np.zeros_like(xp)
y2 = d.pdf(xp)
plt.plot(iqs, d.pdf(iqs))
plt.fill_between(xp, y1, y2, color='red', alpha=0.5)
pass
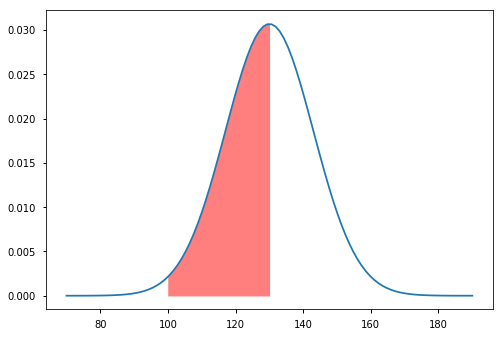
- What fraction of Duke students have IQs between 100 and 130?
In [19]:
d.cdf(130) - d.cdf(100)
Out[19]:
0.48949187188624066
In [33]:
xp = np.linspace(100, 130, 100)
y1 = np.zeros_like(xp)
y2 = d.pdf(xp)
plt.plot(iqs, d.pdf(iqs))
plt.fill_between(xp, y1, y2, color='red', alpha=0.5)
pass
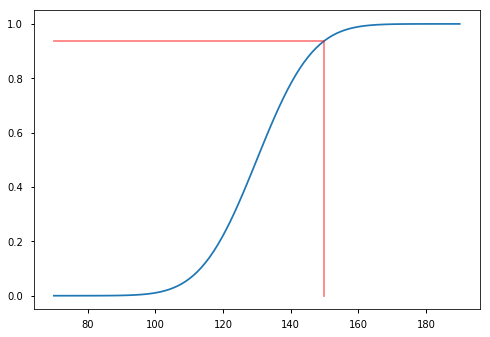
- What percentile would you be if your IQ was 150?
In [20]:
d.cdf(150)
Out[20]:
0.93803209716362879
In [40]:
xs = 70, 150, 150
ys = d.cdf(150), d.cdf(150), 0
plt.plot(iqs, d.cdf(iqs))
plt.plot(xs, ys, color='red', alpha=0.5)
pass
Using simulation
Simulate IQs of 1 million students.
In [21]:
n = int(1e6)
data = d.rvs(n)
- What IQ do you need to be in the top 10 percentile?
In [22]:
data.sort()
data[int(0.9 * n)]
Out[22]:
146.65479002172754
- What fraction of Duke students have IQs between 100 and 130?
In [23]:
((data < 130).sum() - (data < 100).sum())/n
Out[23]:
0.490008
- What percentile would you be if your IQ was 150?
In [24]:
(data < 150).sum()/n
Out[24]:
0.93808499999999995
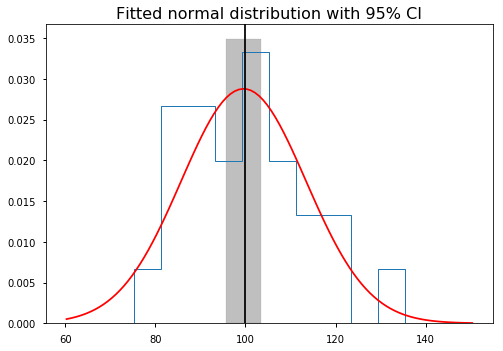
Estimating parameters
In [86]:
n = 50
mu_ = 100
sd_ = 15
d_ = stats.norm(mu_, sd_)
xs = d_.rvs(n)
In [65]:
mu, sd = stats.norm.fit(xs)
d = stats.norm(mu, sd)
In [76]:
d1 = stats.norm(mu, sd/np.sqrt(n))
ci = d1.interval(0.95)
In [106]:
plt.hist(xs, normed=True, histtype='step', linewidth=1)
xp = np.linspace(xs.min() - sd_, xs.max() + sd_, 100)
yp = d.pdf(xp)
plt.plot(xp, yp, color='red')
plt.axvline(mu, color='black')
ymin, ymax = plt.ylim()
plt.fill_between(ci, ymin, ymax, color='grey', alpha=0.5)
plt.title('Fitted normal distribution with 95% CI',
         fontsize=16)
pass
In [60]:
In [ ]: