In [1]:
import numpy as np
import pandas as pd
import matplotlib
import matplotlib.pyplot as plt
import seaborn as sns
%matplotlib inline
In [41]:
import warnings
warnings.filterwarnings("ignore", category=np.VisibleDeprecationWarning)
Customizing Plots
The seaborn homepage is very useful.
To get a feel for what is possible, see
In [2]:
url = 'http://bit.ly/2b72LNj'
df = pd.read_csv(url)
In [3]:
df.head()
Out[3]:
| model | mpg | cyl | disp | hp | drat | wt | qsec | vs | am | gear | carb | |
|---|---|---|---|---|---|---|---|---|---|---|---|---|
| 0 | Mazda RX4 | 21.0 | 6 | 160.0 | 110 | 3.90 | 2.620 | 16.46 | 0 | 1 | 4 | 4 |
| 1 | Mazda RX4 Wag | 21.0 | 6 | 160.0 | 110 | 3.90 | 2.875 | 17.02 | 0 | 1 | 4 | 4 |
| 2 | Datsun 710 | 22.8 | 4 | 108.0 | 93 | 3.85 | 2.320 | 18.61 | 1 | 1 | 4 | 1 |
| 3 | Hornet 4 Drive | 21.4 | 6 | 258.0 | 110 | 3.08 | 3.215 | 19.44 | 1 | 0 | 3 | 1 |
| 4 | Hornet Sportabout | 18.7 | 8 | 360.0 | 175 | 3.15 | 3.440 | 17.02 | 0 | 0 | 3 | 2 |
Customizing matplotlib graphics
Markers and linestyles
A wide range of shapes is available to use as markers, including unfilled and filled markers.
In [4]:
from matplotlib import lines
lines.lineStyles.keys()
Out[4]:
dict_keys(['None', '', ':', ' ', '--', '-.', '-'])
In [5]:
from matplotlib import markers
markers.MarkerStyle.markers.keys()
Out[5]:
dict_keys(['3', 0, 2, '8', 4, '_', 6, 1, 'None', '', '4', 'H', '*', 3, 'h', '>', '<', ' ', 'd', 's', '1', 5, 'D', '+', '2', 'v', 'o', '^', ',', '|', '.', None, 'x', 'p', 7])
The -o notation indicates a solid line - with a filled circle o.
In [6]:
plt.plot('wt', 'mpg', '-o', data = df.sort_values('wt'))
pass

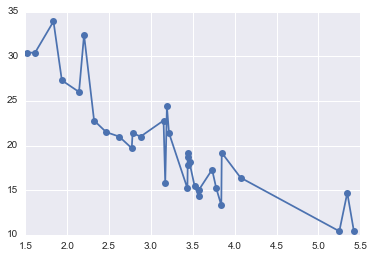
You could achieve the same effect more verbosely as shown here.
In [7]:
plt.plot('wt', 'mpg', linestyle = '-', marker='o', data = df.sort_values('wt'))
pass
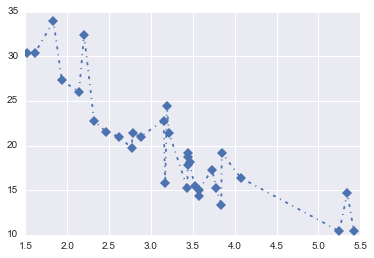
Or change the linstyle and marker
In [8]:
plt.plot('wt', 'mpg', linestyle = '-.', marker='D', data = df.sort_values('wt'))
pass
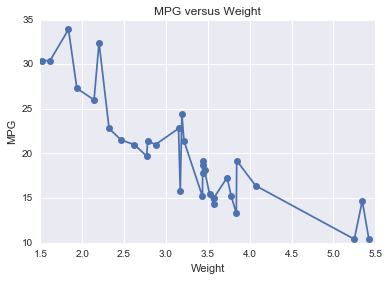
Adding labels
In [9]:
plt.plot('wt', 'mpg', '-o', data = df.sort_values('wt'))
plt.title('MPG versus Weight')
plt.xlabel('Weight')
plt.ylabel('MPG')
pass
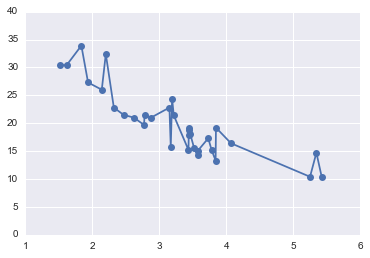
Changing Axes Limits
In [10]:
plt.plot('wt', 'mpg', '-o', data = df.sort_values('wt'))
plt.xlim([1, 6])
plt.ylim([0, 40])

pass
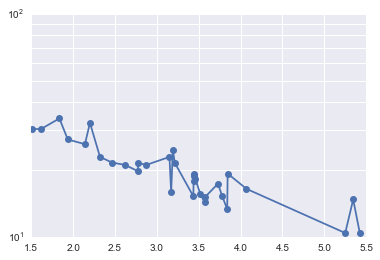
Changing coordinate systems
In [11]:
plt.plot('wt', 'mpg', '-o', data = df.sort_values('wt'))
plt.yscale("log")
plt.yticks(np.linspace(10, 100, 10))
pass
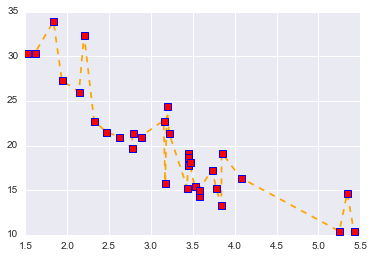
Changing attributes of visual eleemnets
Choosing individual colors
There are many ways to specify colors, but the most convenient is simply by name from this list of available colors.
If you need even more colors, you can also access the XLCDh colors using
sns.xkcd_rgb["pale red"]
To see the colors available
sorted(sns.xkcd_rgb.keys())
For example, there are 206 green variants available!
In [12]:
[c for c in sns.xkcd_rgb if 'green' in c]
Out[12]:
['fern green',
 'greenish turquoise',
 'hot green',
 'highlighter green',
 'poison green',
 'light lime green',
 'soft green',
 'deep green',
 'flat green',
 'bright yellow green',
 'pastel green',
 'boring green',
 'yellowish green',
 'sickly green',
 'snot green',
 'brown green',
 'vivid green',
 'weird green',
 'tea green',
 'greenish grey',
 'light green blue',
 'bright light green',
 'seafoam green',
 'foam green',
 'swamp green',
 'army green',
 'lightish green',
 'booger green',
 'vibrant green',
 'light yellowish green',
 'jade green',
 'green yellow',
 'light sea green',
 'greenish blue',
 'pale green',
 'vomit green',
 'light light green',
 'baby puke green',
 'yellowgreen',
 'leaf green',
 'dark mint green',
 'greeny grey',
 'algae green',
 'lemon green',
 'military green',
 'light grey green',
 'dark grass green',
 'khaki green',
 'toxic green',
 'dusty green',
 'washed out green',
 'shit green',
 'light seafoam green',
 'baby shit green',
 'ocean green',
 'darkgreen',
 'tan green',
 'greenish tan',
 'hunter green',
 'seaweed green',
 'sap green',
 'emerald green',
 'muted green',
 'light green',
 'greenish beige',
 'light neon green',
 'mossy green',
 'kermit green',
 'nasty green',
 'lime green',
 'hospital green',
 'turquoise green',
 'brownish green',
 'forest green',
 'pale lime green',
 'dark forest green',
 'slime green',
 'muddy green',
 'tree green',
 'shamrock green',
 'grass green',
 'very light green',
 'teal green',
 'sea green',
 'pale olive green',
 'light moss green',
 'light pastel green',
 'bluish green',
 'kelley green',
 'grey green',
 'green grey',
 'electric green',
 'lawn green',
 'baby poop green',
 'wintergreen',
 'light bright green',
 'spring green',
 'cool green',
 'mustard green',
 'kelly green',
 'pea green',
 'olive green',
 'bottle green',
 'pine green',
 'greenish yellow',
 'evergreen',
 'gross green',
 'dark green',
 'dark yellow green',
 'aqua green',
 'bright green',
 'blue/green',
 'green brown',
 'greenblue',
 'blue green',
 'barf green',
 'yellow/green',
 'greenish teal',
 'fresh green',
 'greeny yellow',
 'very dark green',
 'faded green',
 'light grass green',
 'light mint green',
 'green blue',
 'bright lime green',
 'british racing green',
 'greenish',
 'baby green',
 'fluro green',
 'bluey green',
 'dark pastel green',
 'dirty green',
 'puke green',
 'poop green',
 'true green',
 'greeny brown',
 'bright sea green',
 'ugly green',
 'dark blue green',
 'grassy green',
 'dark olive green',
 'mint green',
 'acid green',
 'light bluish green',
 'mud green',
 'forrest green',
 'slate green',
 'apple green',
 'sick green',
 'minty green',
 'medium green',
 'pale light green',
 'camo green',
 'darkish green',
 'mid green',
 'browny green',
 'yellowy green',
 'greenish cyan',
 'jungle green',
 'pea soup green',
 'light forest green',
 'light pea green',
 'tealish green',
 'dark sea green',
 'radioactive green',
 'racing green',
 'dark seafoam green',
 'off green',
 'turtle green',
 'irish green',
 'greeny blue',
 'dark green blue',
 'dull green',
 'lighter green',
 'green',
 'lightgreen',
 'light greenish blue',
 'navy green',
 'neon green',
 'easter green',
 'murky green',
 'yellow green',
 'drab green',
 'light olive green',
 'fluorescent green',
 'green teal',
 'light yellow green',
 'grey/green',
 'greenish brown',
 'icky green',
 'leafy green',
 'frog green',
 'moss green',
 'camouflage green',
 'avocado green',
 'light blue green',
 'greyish green',
 'bluegreen',
 'green/blue',
 'green apple',
 'sage green',
 'dark lime green',
 'green/yellow',
 'kiwi green',
 'very pale green']
In [13]:
plt.plot('wt', 'mpg', color = 'orange', linestyle = 'dashed',
         marker = 's', mec = 'blue', mew = 1, mfc = 'red',
         data = df.sort_values('wt'))
pass
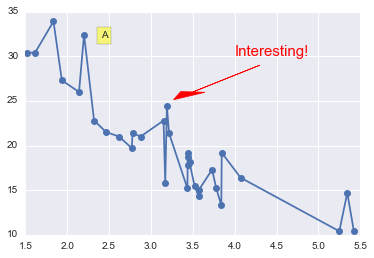
Adding annotations
In [14]:
plt.plot('wt', 'mpg', '-o', data = df.sort_values('wt'))
plt.text(4.0, 30.0, 'Interesting!', fontsize = 15, color = 'red')
plt.text(2.4, 32, 'A', bbox = dict(facecolor='yellow', alpha =0.5))
plt.arrow(4.3, 29, -0.80, -3, head_length = 0.9, head_width = 0.3, fc='r', ec='r', lw =0.75)
pass
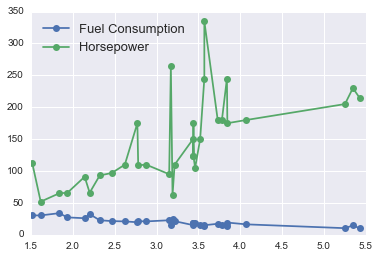
Adding legends
In [15]:
plt.plot('wt', 'mpg', '-o', data = df.sort_values('wt'), label = 'Fuel Consumption')
plt.plot('wt', 'hp', '-o', data = df.sort_values('wt'), label = 'Horsepower')
plt.legend(loc = 'upper left', fontsize = 13)
pass
Using styles
In [16]:
plt.style.available
Out[16]:
['ggplot',
 'presentation',
 'seaborn-paper',
 'seaborn-dark',
 'dark_background',
 'seaborn-poster',
 'seaborn-white',
 'seaborn-talk',
 'seaborn-colorblind',
 'seaborn-notebook',
 'seaborn-pastel',
 'seaborn-muted',
 'seaborn-whitegrid',
 'grayscale',
 'seaborn-darkgrid',
 'bmh',
 'seaborn-dark-palette',
 'classic',
 'seaborn-ticks',
 'fivethirtyeight',
 'seaborn-deep',
 'seaborn-bright']
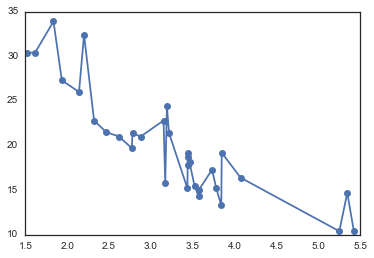
In [17]:
with plt.style.context('seaborn-white'):
    plt.plot('wt', 'mpg', '-o', data = df.sort_values('wt'))
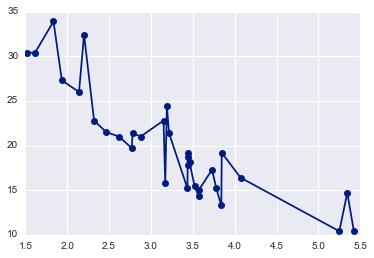
In [18]:
with plt.style.context('seaborn-dark-palette'):
    plt.plot('wt', 'mpg', '-o', data = df.sort_values('wt'))
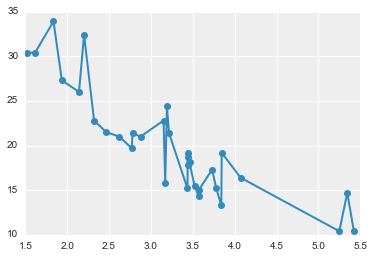
In [19]:
with plt.style.context('bmh'):
    plt.plot('wt', 'mpg', '-o', data = df.sort_values('wt'))
In [20]:
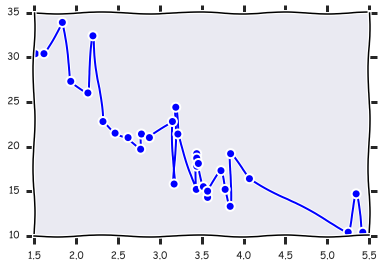
with plt.xkcd():
    plt.plot('wt', 'mpg', '-o', data = df.sort_values('wt'))
Customizing seaborn graphics
Since seaborn is built on top of matplotlib, customization
options for matplotlib will also work with seaborn. However,
seabornn plotting functions often give much more scope for
customization.
Choosing a color palette
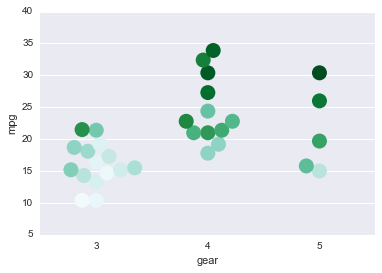
If you see the argument palette in the function, it means that you
can choose a color scheme. For example, here we choose a BuGn_r
color scheme, which is short for colors in the range Blue to Green
(reversed) - that is, high values are blue and low values are blue. Here
the hue is for wt, so the lightest cars will be green and the
heaviest blue. See
here
for a description of palettes available in seaborn.
Sometimes you see the argument cmap in a function instead of
palette - this is the equivalent concept for Matplotlib functions.
Here you can either use a Matplotlib
colormap or convert a
seaborn palette to the colormap format by using the as_cmap() method:
sns.color_palette("GnBu_d").as_cmap()
In [21]:
ax = sns.swarmplot('gear', 'mpg', hue = 'wt',
                   size = 15, palette = "BuGn_r",
                   data = df)
ax.legend_.remove()
pass
Layout for Multiple Plots
Data aware grids
In [22]:
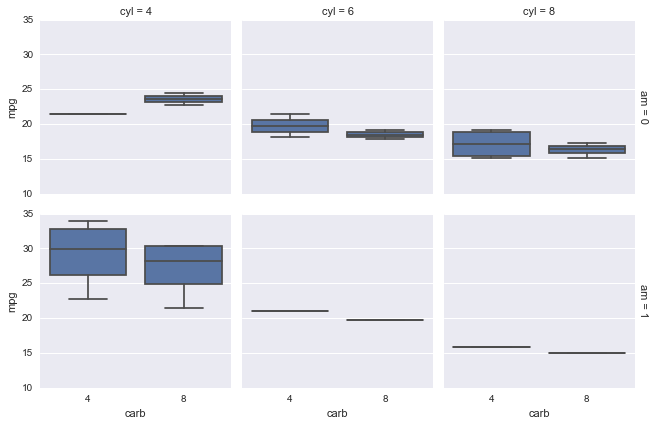
g = sns.FacetGrid(df, row="am", col="cyl", margin_titles=True)
g.map(sns.boxplot, 'carb', 'mpg')
pass
In [42]:
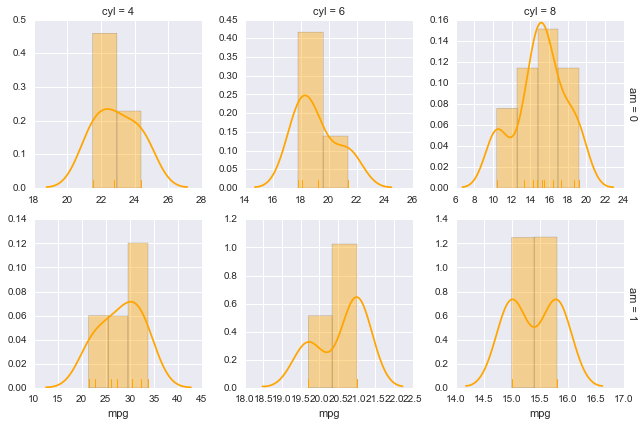
g = sns.FacetGrid(df, row="am", col="cyl", margin_titles=True,
                  sharex = False, sharey = False)
g.map(sns.distplot, 'mpg', rug = True, color = "orange")
pass
Pairwise Plots
In [24]:
df1 = df[['mpg', 'hp', 'drat', 'wt', 'qsec']]
In [43]:
g = sns.PairGrid(df1)
g.map_upper(plt.scatter)
g.map_lower(sns.kdeplot)
g.map_diag(sns.kdeplot, lw=3, legend=False)
pass
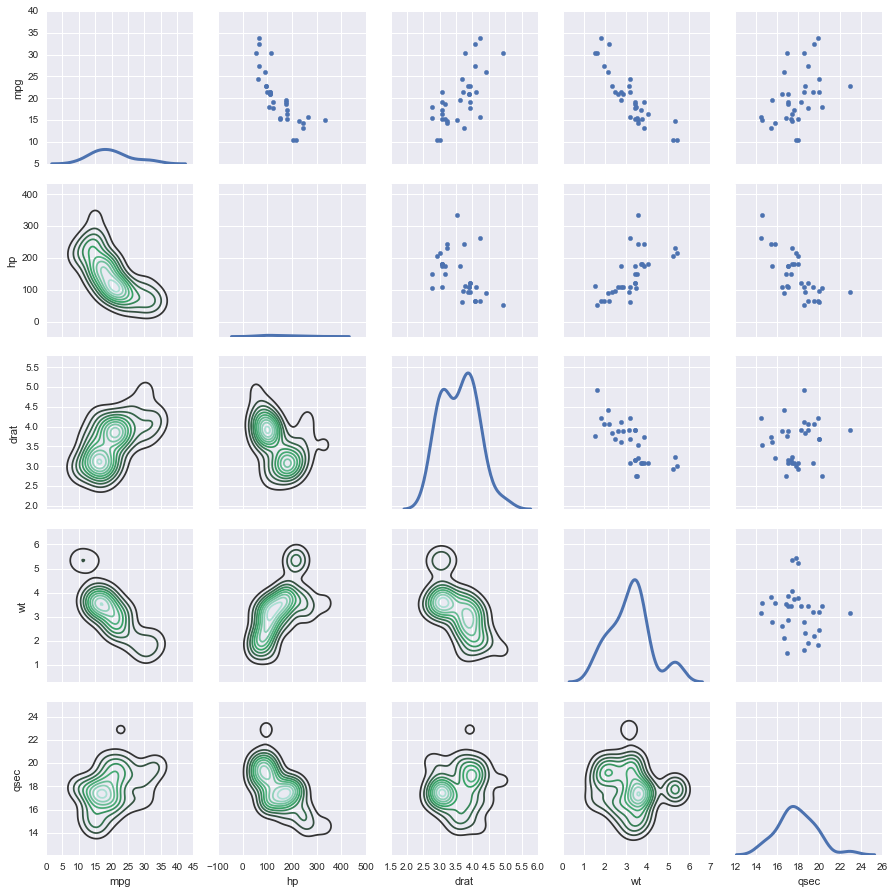
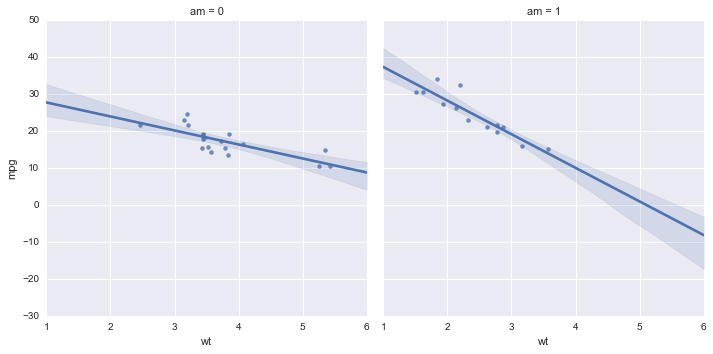
Several seaborn plots use these grids under the hood
In [26]:
sns.lmplot(x = 'wt', y = 'mpg', col = 'am', data = df)
pass
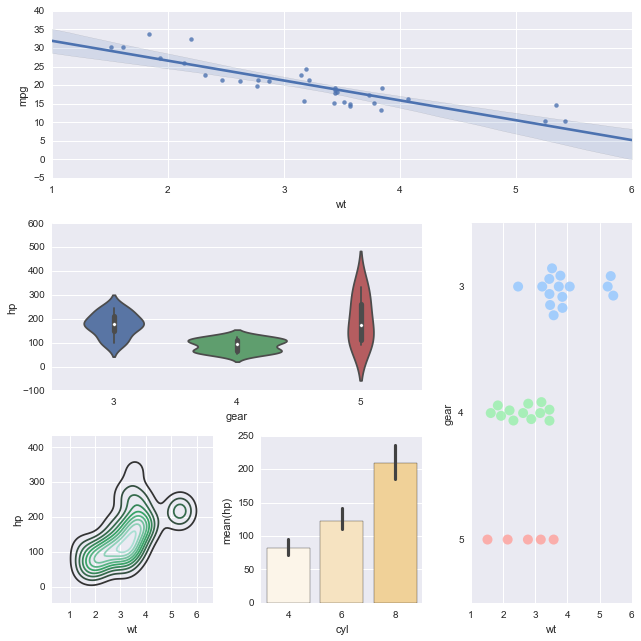
Laying Out Multiple Different Types of Plots
See more custom layout examples.
In [27]:
plt.figure(figsize=(9,9))
ax1 = plt.subplot2grid((3,3), (0,0), colspan=3)
ax2 = plt.subplot2grid((3,3), (1,0), colspan=2)
ax3 = plt.subplot2grid((3,3), (1, 2), rowspan=2)
ax4 = plt.subplot2grid((3,3), (2, 0))
ax5 = plt.subplot2grid((3,3), (2, 1))

sns.regplot('wt', 'mpg', data = df, ax = ax1)
sns.violinplot('gear', 'hp', data = df, ax = ax2)
sns.swarmplot('wt', 'gear', data = df, orient = "h",
              size = 10, alpha = 0.8, split = True, palette = 'pastel', ax = ax3)
sns.kdeplot(df.wt, df.hp, ax = ax4)
sns.barplot('cyl', 'hp', data = df,
            palette = sns.light_palette('orange'),  ax = ax5)
plt.tight_layout()
Exercises
1a. Load the iris data set found in data/iris.csv into a
DataFrame named iris.
- How many rows and columns are there in
iris? - Display the first 6 rows.
In [28]:
iris = pd.read_csv('data/iris.csv')
print(iris.shape)
iris.head()
(150, 5)
Out[28]:
| Sepal.Length | Sepal.Width | Petal.Length | Petal.Width | Species | |
|---|---|---|---|---|---|
| 0 | 5.1 | 3.5 | 1.4 | 0.2 | setosa |
| 1 | 4.9 | 3.0 | 1.4 | 0.2 | setosa |
| 2 | 4.7 | 3.2 | 1.3 | 0.2 | setosa |
| 3 | 4.6 | 3.1 | 1.5 | 0.2 | setosa |
| 4 | 5.0 | 3.6 | 1.4 | 0.2 | setosa |
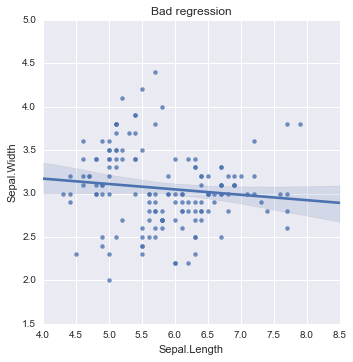
1b. Make a regression plot of Sepal.Length (x-coordinate) by
Sepal.Width (y-coordinate) using the lmplot function. Add a title
“Bad regression”.
In [29]:
sns.lmplot(data=iris, x='Sepal.Length', y='Sepal.Width')
plt.title('Bad regression')
pass
1c. Create a new figure where you fit separate linear regressions of Sepal.Length (x-coordinate) by Sepal.Width for each species on the same plot.
In [30]:
sns.lmplot(data=iris, x='Sepal.Length', y='Sepal.Width', hue='Species')
pass
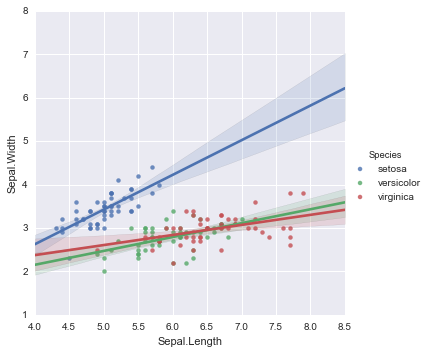
1d. Create a new figure where you have separate linear regression plots of Sepal.Length (x-coordinate) by Sepal.Width for each species. This figure should have 1 row and 3 columns.
In [31]:
sns.lmplot(data=iris, x='Sepal.Length', y='Sepal.Width', col='Species')
pass

1e Create a new figure with 2 roww and 2 columns, where each figure
shows a swarmplot comparing one of the 4 flower features
(Sepal.Length, Sepal.Width, Petal.Length, Petal.Width) across Species.
Challenge: Can you do this in two lines of code?
In [32]:
data = pd.melt(iris, id_vars='Species')
sns.factorplot(data=data, x='Species', y='value', col='variable', col_wrap=2, kind='swarm')
pass
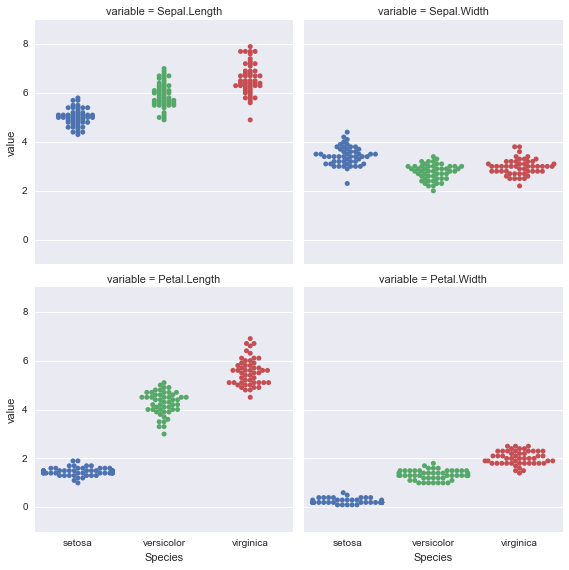
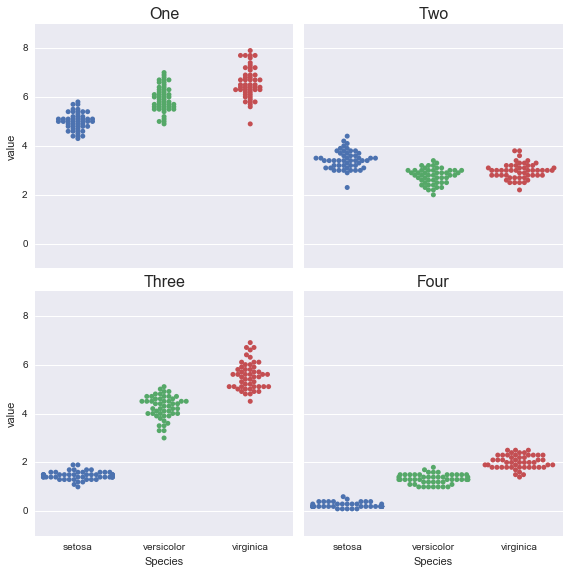
1f. Repeat the exercise in 1e, but change the titles of the subplots to “One” and “Two” for the first row and “Three”, “Four” for the second row.
In [33]:
data = pd.melt(iris, id_vars='Species')
g = sns.factorplot(data=data, x='Species', y='value', col='variable', col_wrap=2, kind='swarm')
titles = ['One', 'Two', 'Three', 'Four']
for ax, title in zip(g.axes, titles):
    ax.set_title(title, fontsize=16)
pass
