Machine Learning with sklearn
This is mostly a tutorial to illustrate how to use scikit-learn to
perform common machine learning pipelines. It is NOT meant to show how
to do machine learning tasks well - you should take a machine learning
course for that.
In [1]:
import warnings
warnings.filterwarnings('ignore')
Resources
Example
We will try to separate rocks from mines using this [data set](https://archive.ics.uci.edu/ml/datasets/Connectionist+Bench+(Sonar,+Mines+vs.+Rocks).
From the description provided:
Data Set Information:

The file "sonar.mines" contains 111 patterns obtained by bouncing sonar signals off a metal cylinder at various angles and under various conditions. The file "sonar.rocks" contains 97 patterns obtained from rocks under similar conditions. The transmitted sonar signal is a frequency-modulated chirp, rising in frequency. The data set contains signals obtained from a variety of different aspect angles, spanning 90 degrees for the cylinder and 180 degrees for the rock.

Each pattern is a set of 60 numbers in the range 0.0 to 1.0. Each number represents the energy within a particular frequency band, integrated over a certain period of time. The integration aperture for higher frequencies occur later in time, since these frequencies are transmitted later during the chirp.

The label associated with each record contains the letter "R" if the object is a rock and "M" if it is a mine (metal cylinder). The numbers in the labels are in increasing order of aspect angle, but they do not encode the angle directly.
In [2]:
df = pd.read_csv('https://archive.ics.uci.edu/ml/machine-learning-databases/undocumented/connectionist-bench/sonar/sonar.all-data', header=None, prefix='X')
In [3]:
df.shape
Out[3]:
(208, 61)
The last column are labels - make it a cateogry
In [4]:
df.rename(columns={'X60':'Label'}, inplace=True)
df.Label = df.Label.astype('category')
In [5]:
df.head()
Out[5]:
| X0 | X1 | X2 | X3 | X4 | X5 | X6 | X7 | X8 | X9 | ... | X51 | X52 | X53 | X54 | X55 | X56 | X57 | X58 | X59 | Label | |
|---|---|---|---|---|---|---|---|---|---|---|---|---|---|---|---|---|---|---|---|---|---|
| 0 | 0.0200 | 0.0371 | 0.0428 | 0.0207 | 0.0954 | 0.0986 | 0.1539 | 0.1601 | 0.3109 | 0.2111 | ... | 0.0027 | 0.0065 | 0.0159 | 0.0072 | 0.0167 | 0.0180 | 0.0084 | 0.0090 | 0.0032 | R |
| 1 | 0.0453 | 0.0523 | 0.0843 | 0.0689 | 0.1183 | 0.2583 | 0.2156 | 0.3481 | 0.3337 | 0.2872 | ... | 0.0084 | 0.0089 | 0.0048 | 0.0094 | 0.0191 | 0.0140 | 0.0049 | 0.0052 | 0.0044 | R |
| 2 | 0.0262 | 0.0582 | 0.1099 | 0.1083 | 0.0974 | 0.2280 | 0.2431 | 0.3771 | 0.5598 | 0.6194 | ... | 0.0232 | 0.0166 | 0.0095 | 0.0180 | 0.0244 | 0.0316 | 0.0164 | 0.0095 | 0.0078 | R |
| 3 | 0.0100 | 0.0171 | 0.0623 | 0.0205 | 0.0205 | 0.0368 | 0.1098 | 0.1276 | 0.0598 | 0.1264 | ... | 0.0121 | 0.0036 | 0.0150 | 0.0085 | 0.0073 | 0.0050 | 0.0044 | 0.0040 | 0.0117 | R |
| 4 | 0.0762 | 0.0666 | 0.0481 | 0.0394 | 0.0590 | 0.0649 | 0.1209 | 0.2467 | 0.3564 | 0.4459 | ... | 0.0031 | 0.0054 | 0.0105 | 0.0110 | 0.0015 | 0.0072 | 0.0048 | 0.0107 | 0.0094 | R |
5 rows × 61 columns
Exploratory data analysis
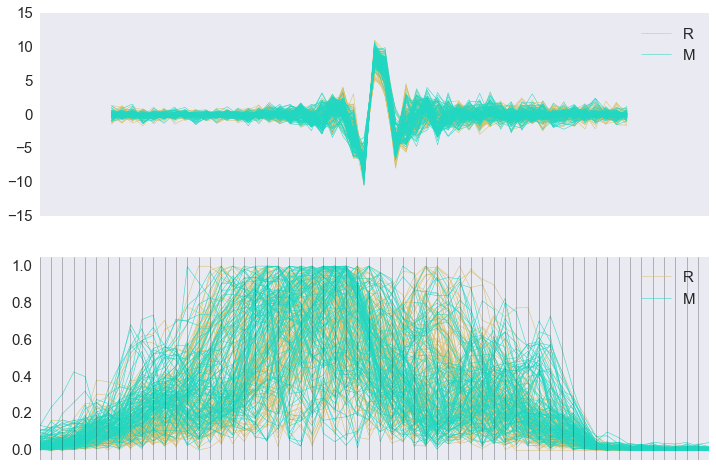
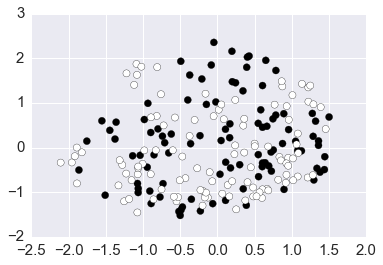
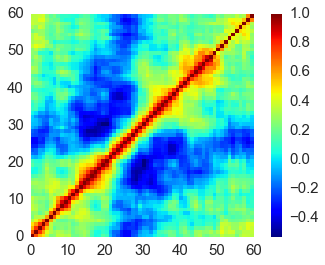
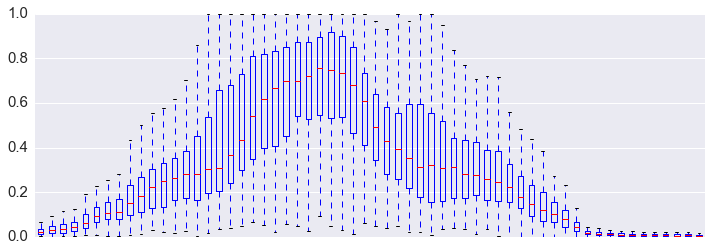
We can use simple plots to get some idea of what the data looks like
- Is the separation between rocks and mines obvious?
- How correlated are the variables?
- Do we need to standardize?
- Are there outliers?
In [6]:
from pandas.tools.plotting import andrews_curves, parallel_coordinates
In [7]:
fig, axes = plt.subplots(2,1,figsize=(12,8))
andrews_curves(df, 'Label', samples=50, linewidth=0.5, ax=axes[0])
axes[0].set_xticks([])
parallel_coordinates(df, 'Label', linewidth=0.5, ax=axes[1],
                     axvlines_kwds={'linewidth': 0.5, 'color': 'black', 'alpha':0.5})
axes[1].set_xticks([])
axes[1].margins(0.05)
pass
In [8]:
from sklearn.manifold import MDS
In [9]:
mds = MDS(n_components=2)
In [10]:
mds_data = mds.fit_transform(df.ix[:, :-1])
In [11]:
plt.scatter(mds_data[:, 0], mds_data[:, 1], c=df.Label.cat.codes, s=50);
In [12]:
heatmap = plt.pcolor(df.corr(), cmap='jet')
plt.colorbar(heatmap)
plt.gca().set_aspect('equal')
In [13]:
df.plot.box(figsize=(12,4), xticks=[])
pass
In [14]:
df.plot.density(figsize=(6, 60), subplots=True, yticks=[])
pass

Preprocessing
Box plots suggest we should standardize the data
In [15]:
from sklearn.preprocessing import StandardScaler, RobustScaler
In [16]:
data, labels = df.ix[:, :-1], df.ix[:, -1]
In [17]:
data.head(3)
Out[17]:
| X0 | X1 | X2 | X3 | X4 | X5 | X6 | X7 | X8 | X9 | ... | X50 | X51 | X52 | X53 | X54 | X55 | X56 | X57 | X58 | X59 | |
|---|---|---|---|---|---|---|---|---|---|---|---|---|---|---|---|---|---|---|---|---|---|
| 0 | 0.0200 | 0.0371 | 0.0428 | 0.0207 | 0.0954 | 0.0986 | 0.1539 | 0.1601 | 0.3109 | 0.2111 | ... | 0.0232 | 0.0027 | 0.0065 | 0.0159 | 0.0072 | 0.0167 | 0.0180 | 0.0084 | 0.0090 | 0.0032 |
| 1 | 0.0453 | 0.0523 | 0.0843 | 0.0689 | 0.1183 | 0.2583 | 0.2156 | 0.3481 | 0.3337 | 0.2872 | ... | 0.0125 | 0.0084 | 0.0089 | 0.0048 | 0.0094 | 0.0191 | 0.0140 | 0.0049 | 0.0052 | 0.0044 |
| 2 | 0.0262 | 0.0582 | 0.1099 | 0.1083 | 0.0974 | 0.2280 | 0.2431 | 0.3771 | 0.5598 | 0.6194 | ... | 0.0033 | 0.0232 | 0.0166 | 0.0095 | 0.0180 | 0.0244 | 0.0316 | 0.0164 | 0.0095 | 0.0078 |
3 rows × 60 columns
In [18]:
data_scaled = DataFrame(StandardScaler().fit_transform(data), columns=data.columns)
In [19]:
data_scaled.head(3)
Out[19]:
| X0 | X1 | X2 | X3 | X4 | X5 | X6 | X7 | X8 | X9 | ... | X50 | X51 | X52 | X53 | X54 | X55 | X56 | X57 | X58 | X59 | |
|---|---|---|---|---|---|---|---|---|---|---|---|---|---|---|---|---|---|---|---|---|---|
| 0 | -0.399551 | -0.040648 | -0.026926 | -0.715105 | 0.364456 | -0.101253 | 0.521638 | 0.297843 | 1.125272 | 0.021186 | ... | 0.595283 | -1.115432 | -0.597604 | 0.680897 | -0.295646 | 1.481635 | 1.763784 | 0.069870 | 0.171678 | -0.658947 |
| 1 | 0.703538 | 0.421630 | 1.055618 | 0.323330 | 0.777676 | 2.607217 | 1.522625 | 2.510982 | 1.318325 | 0.588706 | ... | -0.297902 | -0.522349 | -0.256857 | -0.843151 | 0.015503 | 1.901046 | 1.070732 | -0.472406 | -0.444554 | -0.419852 |
| 2 | -0.129229 | 0.601067 | 1.723404 | 1.172176 | 0.400545 | 2.093337 | 1.968770 | 2.852370 | 3.232767 | 3.066105 | ... | -1.065875 | 1.017585 | 0.836373 | -0.197833 | 1.231812 | 2.827246 | 4.120162 | 1.309360 | 0.252761 | 0.257582 |
3 rows × 60 columns
If there are gross outliers, we can use a robust routine
In [20]:
data_robust = DataFrame(RobustScaler().fit_transform(data), columns=data.columns)
In [21]:
data_robust.head(3)
Out[21]:
| X0 | X1 | X2 | X3 | X4 | X5 | X6 | X7 | X8 | X9 | ... | X50 | X51 | X52 | X53 | X54 | X55 | X56 | X57 | X58 | X59 | |
|---|---|---|---|---|---|---|---|---|---|---|---|---|---|---|---|---|---|---|---|---|---|
| 0 | -0.126126 | 0.200000 | 0.217949 | -0.581931 | 0.528726 | 0.096125 | 0.642271 | 0.538267 | 1.163123 | 0.182309 | ... | 0.750000 | -0.920635 | -0.310433 | 0.723288 | -0.037736 | 1.595142 | 1.791822 | 0.385185 | 0.390977 | -0.387097 |
| 1 | 1.013514 | 0.682540 | 1.282051 | 0.619315 | 0.896746 | 2.476155 | 1.486320 | 2.646482 | 1.330279 | 0.665714 | ... | -0.112903 | -0.317460 | -0.066158 | -0.493151 | 0.238994 | 1.983806 | 1.197026 | -0.133333 | -0.180451 | -0.165899 |
| 2 | 0.153153 | 0.869841 | 1.938462 | 1.601246 | 0.560868 | 2.024590 | 1.862517 | 2.971685 | 2.987903 | 2.775925 | ... | -0.854839 | 1.248677 | 0.717557 | 0.021918 | 1.320755 | 2.842105 | 3.814126 | 1.570370 | 0.466165 | 0.460829 |
3 rows × 60 columns
Dimension reduction
In [22]:
from sklearn.decomposition import PCA
In [23]:
data.shape
Out[23]:
(208, 60)
In [24]:
pca = PCA()
data_scaled_pca = DataFrame(pca.fit_transform(data_scaled), columns=data.columns)
In [25]:
data_scaled.shape
Out[25]:
(208, 60)
In [26]:
v = pca.explained_variance_ratio_
vc = v.cumsum()
DataFrame(list(zip(it.count(), v, vc)), columns=['pc', 'explained', 'cumsum']).head(10)
Out[26]:
| pc | explained | cumsum | |
|---|---|---|---|
| 0 | 0 | 0.203466 | 0.203466 |
| 1 | 1 | 0.188972 | 0.392438 |
| 2 | 2 | 0.085500 | 0.477938 |
| 3 | 3 | 0.056792 | 0.534730 |
| 4 | 4 | 0.050071 | 0.584800 |
| 5 | 5 | 0.040650 | 0.625450 |
| 6 | 6 | 0.032790 | 0.658240 |
| 7 | 7 | 0.030465 | 0.688705 |
| 8 | 8 | 0.025660 | 0.714364 |
| 9 | 9 | 0.024911 | 0.739275 |
Let’s just use the principal components that explain at least 95% of total variance
In [27]:
n_comps = 1 + np.argmax(vc > 0.95)
n_comps
Out[27]:
30
In [28]:
data_scaled_pca = data_scaled_pca.ix[:, :n_comps]
data_scaled_pca.shape
Out[28]:
(208, 30)
In [29]:
data_scaled_pca.head()
Out[29]:
| X0 | X1 | X2 | X3 | X4 | X5 | X6 | X7 | X8 | X9 | ... | X20 | X21 | X22 | X23 | X24 | X25 | X26 | X27 | X28 | X29 | |
|---|---|---|---|---|---|---|---|---|---|---|---|---|---|---|---|---|---|---|---|---|---|
| 0 | 1.921168 | 1.370893 | -1.666476 | 0.837913 | -1.057324 | -1.712504 | 1.785716 | 1.581264 | 0.335418 | 1.028065 | ... | -1.208238 | -0.723202 | -0.304876 | -0.120470 | 0.458567 | -0.021847 | -1.089710 | -0.096606 | -0.168123 | -0.753434 |
| 1 | -0.480125 | -7.586388 | -1.275734 | 3.859346 | 2.121112 | 2.186818 | -1.742764 | -1.517061 | 0.307933 | 1.341882 | ... | -2.388110 | -0.021429 | 0.145524 | 0.246021 | -0.117770 | 0.704112 | -0.052387 | 0.240064 | 0.178744 | -0.554605 |
| 2 | 3.859228 | -6.439860 | -0.030635 | 5.454599 | 1.552060 | -1.181619 | -1.820138 | 1.495929 | -1.152459 | 1.006030 | ... | -1.740823 | 2.000942 | 0.295682 | -1.931963 | -0.758036 | -0.113901 | 0.964319 | -0.214707 | -0.527529 | -0.033003 |
| 3 | 4.597419 | 3.104089 | -1.785344 | -1.115908 | -2.785528 | 2.072673 | 2.084530 | -1.707289 | 0.452390 | 1.117318 | ... | -0.685825 | -1.307367 | 0.662918 | -1.142591 | 0.352601 | -0.491193 | -0.061186 | -0.150725 | -1.389191 | 0.642030 |
| 4 | -0.533868 | -1.849847 | -0.860097 | 3.302076 | 2.808954 | 0.783945 | 0.362657 | -0.812621 | 0.184578 | 0.023594 | ... | 0.503340 | -0.258970 | -0.253982 | -1.199262 | 0.165722 | -0.041342 | -0.589311 | 0.500720 | 1.549835 | -0.783667 |
5 rows × 30 columns
In [30]:
df_pca = pd.concat([data_scaled_pca, labels], axis=1)
df_pca.shape
Out[30]:
(208, 31)
Classification
In [31]:
from sklearn.cross_validation import train_test_split
In [32]:
X_train, X_test, y_train, y_test = \
  train_test_split(data_scaled_pca, labels, test_size=0.33, random_state=42)
In [33]:
from sklearn.linear_model import LogisticRegression
In [34]:
lr = LogisticRegression()
In [35]:
lr.fit(X_train, y_train)
Out[35]:
LogisticRegression(C=1.0, class_weight=None, dual=False, fit_intercept=True,
          intercept_scaling=1, max_iter=100, multi_class='ovr', n_jobs=1,
          penalty='l2', random_state=None, solver='liblinear', tol=0.0001,
          verbose=0, warm_start=False)
Accuracy score
In [36]:
lr.score(X_test, y_test)
Out[36]:
0.78260869565217395
Using Support Vector Classifier and Grid Search
In [37]:
from sklearn.svm import SVC
from sklearn.grid_search import GridSearchCV
In [38]:
parameters = [{'kernel': ['rbf'], 'gamma': [1e-3, 1e-4],
               'C': [1, 10, 100, 1000]},
               {'kernel': ['linear'], 'C': [1, 10, 100, 1000]}]
Do grid search with parallel jobs
In [39]:
clf = GridSearchCV(SVC(C=1), parameters, cv=5, scoring='accuracy', n_jobs=-1)
clf.fit(X_train, y_train.codes)
pass
In [40]:
clf.best_params_
Out[40]:
{'C': 1000, 'gamma': 0.001, 'kernel': 'rbf'}
In [41]:
clf.best_score_
Out[41]:
0.76978417266187049
In [42]:
clf.score(X_test, y_test.codes)
Out[42]:
0.88405797101449279
In [43]:
from sklearn.metrics import classification_report
In [44]:
y_true, y_pred = y_test.codes, clf.predict(X_test)
print(classification_report(y_true, y_pred))
             precision    recall  f1-score   support

          0       0.88      0.92      0.90        38
          1       0.90      0.84      0.87        31

avg / total       0.88      0.88      0.88        69
Using a Random Forests Classifier
In [45]:
from sklearn.ensemble import RandomForestClassifier
In [46]:
X_train, X_test, y_train, y_test = \
  train_test_split(data_scaled, labels, test_size=0.33, random_state=42)
In [47]:
parameters = [{'n_estimators': list(range(25, 201, 25)),
               'max_features': list(range(2, 15, 2))}]
clf = GridSearchCV(RandomForestClassifier(), parameters,
                   cv=5, scoring='accuracy', n_jobs=-1)
clf.fit(X_train, y_train.codes)
pass
In [48]:
clf.best_params_
Out[48]:
{'max_features': 2, 'n_estimators': 100}
In [49]:
clf.score(X_test, y_test.codes)
Out[49]:
0.85507246376811596
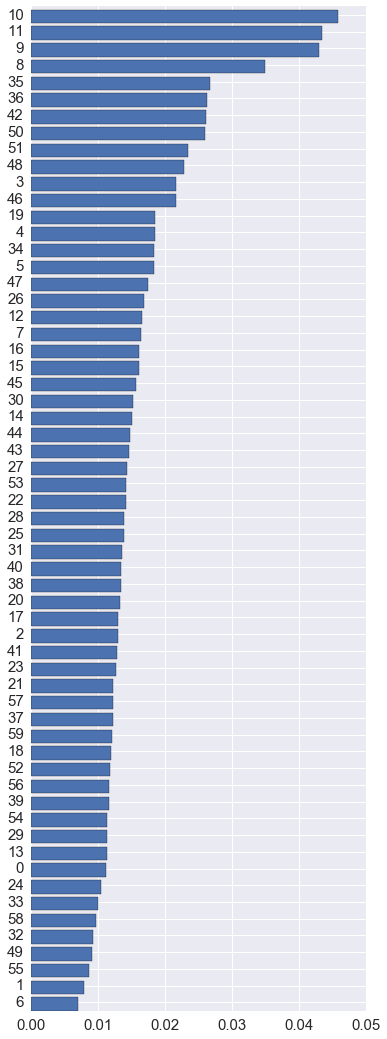
Which features are important?
In [50]:
imp = clf.best_estimator_.feature_importances_
idx = np.argsort(imp)
In [51]:
plt.figure(figsize=(6, 18))
plt.barh(range(len(imp)), imp[idx])
plt.yticks(np.arange(len(imp))+0.5, idx)
pass
Using a Pipeline
For cross-validation (e.g. grid search for best parameters), we often need to chain a series of steps and treat it as a single model. This chaining can be done wiht a Pipeline object.
In [52]:
from sklearn.pipeline import Pipeline
In [53]:
X_train, X_test, y_train, y_test = \
  train_test_split(data_scaled, labels, test_size=0.33, random_state=42)
In [54]:
scaler = StandardScaler()
pca = PCA()
clf = LogisticRegression()

pipe = Pipeline(steps=[('scaler', scaler), ('pca', pca), ('clf', clf)])
n_components = [20, 30, 40, 50, 60]
Cs = np.logspace(-4, 4, 1)

estimator = GridSearchCV(pipe,
                         dict(pca__n_components=n_components,
                         clf__C=Cs), n_jobs=-1)
estimator.fit(X_train, y_train.codes)
pass
In [55]:
estimator.best_estimator_.named_steps['pca'].n_components
Out[55]:
30
In [56]:
estimator.score(X_test, y_test.codes)
Out[56]:
0.76811594202898548
In [57]:
y_true, y_pred = y_test.codes, estimator.predict(X_test)
print(classification_report(y_true, y_pred))
             precision    recall  f1-score   support

          0       0.84      0.71      0.77        38
          1       0.70      0.84      0.76        31

avg / total       0.78      0.77      0.77        69
In [58]:
%load_ext version_information
%version_information numpy, pandas, sklearn
Out[58]:
| Software | Version |
|---|---|
| Python | 3.5.1 64bit [GCC 4.2.1 (Apple Inc. build 5577)] |
| IPython | 4.0.1 |
| OS | Darwin 15.2.0 x86_64 i386 64bit |
| numpy | 1.10.4 |
| pandas | 0.17.1 |
| sklearn | 0.17 |
| Wed Jan 27 15:04:45 2016 EST | |
In [ ]: