An example application
Getting started
To get the data used in this example go to FCS files and other relevant data and download the 11C-EQAPOL-1 data set. Then download the PositivityExample.py and PositivityLib.py from the same page. Move to a directory where both the data directory is present as well as the python library. Then run the PositivityExample.py file or from within a Python Interpreter carry out the following.
>>> import os,pprint
>>> fileList = os.listdir("eqapol-11c-1")
>>> filePathList = [os.path.join(os.getcwd(),"eqapol-11c-1",fn) for fn in fileList]
>>> pp = pprint.PrettyPrinter(indent=4)
>>> pp.pprint(fileList)
[   'G69019FF_SEB_CD4.fcs',
    'G69019FF_CMVpp65_CD4.fcs',
    'G69019FF_Costim_CD4.fcs']
Read the files into python using py-fcm.
>>> import fcm
>>> fcsList = []
>>> for filePath in filePathList:
...     fcsData = fcm.loadFCS(filePath,auto_comp=False,transform=None)
...     fcsData.logicle(scale_max=1e05)
...     fcsList.append(fcsData)
...
G69019FF_SEB_CD4
G69019FF_CMVpp65_CD4
G69019FF_Costim_CD4
Define the channels
>>> pp.pprint(fcsList[0].channels)
[   'FSC-A',
    'FSC-H',
    'FSC-W',
    'SSC-A',
    'SSC-H',
    'SSC-W',
    'Time',
    'CD4 Percp Cy 5 5',
    'CD57 FITC',
    'IFNg PE Cy7',
    'CD107 PE Cy5',
    'CD45RO ECD',
    'IL2 PE',
    'CD8 APC Cy7',
    'TNFa Alexa700',
    'CD27 APC',
    'CD3 KrO',
    'Dump']
>>> channelDict = {'FSC':1,'SSC':4,'CD57':8,'CD4':7,'dump':17,
...                'CD3':16,'CD27':15,'TNFa':14,'CD8':13,
...                'IL2':12,'CD45RO':11,'CD107':10,'IFNg':9}
Find the positivity threshold
>>> from PositivityLib import *
>>> posControlFile = 'G69019FF_SEB_CD4.fcs'
>>> negControlFile = 'G69019FF_Costim_CD4.fcs'
>>> beta = 0.8
>>> cytokine = 'IL2'
>>> positiveEvents = get_events(posControlFile,fileList,fcsList)
>>> positiveEvents.shape
(34296, 18)
>>> negativeEvents = get_events(negControlFile,fileList,fcsList)
>>> negativeEvents.shape
(26276, 18)
>>> fResults = get_positivity_threshold(negativeEvents,positiveEvents,channelDict[cytokine],beta=beta)
>>> fResults['threshold']
30920.8675596
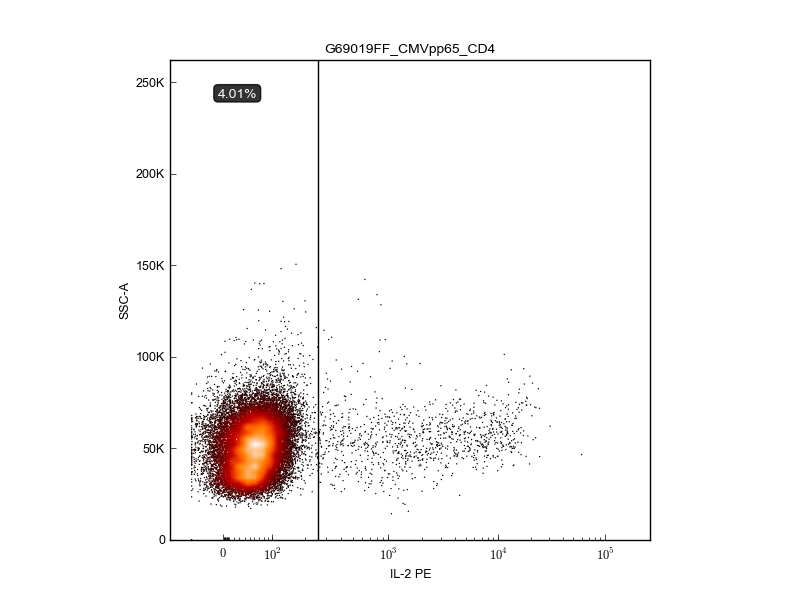
Get the percentages, counts, and indices—then plot
>>> percentages, counts, idx = get_cytokine_positive_events(channelDict[cytokine],fResults['threshold'],
...                                                         fileList,fcsList)
>>> import matplotlib.pyplot as plt
>>> fig = plt.figure(figsize=(8,6))
>>> ax = fig.add_subplot(111)
>>> create_plot(fig,ax,'G69019FF_CMVpp65_CD4.fcs',cytokine,channelDict,fileList,fcsList,fResults,
...             percentages,counts,idx)