Algorithm implementation
The manuscript proposes the idea of using the f-measure to draw positivity thresholds in flow cytometry. Positivity thresholds are needed in cases such as with intracellular staining (ICS) for cytokines and the f-measure overcomes the subjectivity of traditional methods that require manual intervention.
The f-measure or f-score can be defined in terms of true positives
(TP), false positives (FP) and false negatives (FN). We can express
these measures in terms of precision and recall where precision
is defined as  and recall as
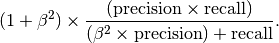
 . We can then write the
f-score as
. We can then write the
f-score as
The following are the functions that are used in the An example application:
List of functions
For your convenience the following functions are available as a Python library PositivityLib.py
The following package imports need to be made.
>>> import os, sys
>>> import numpy as np
Get positivity threshold
In order to calculate the f-score the probability density functions (pdf) are found using histogram representations of the data. The number of bins numBins controls how smoothly the pdf fits the actual distribution of events.
def get_positivity_threshold(neg,pos,channelIndex,beta=0.8,theta=2.0, width=10, numBins=None):
    '''
    In order to calculate the f-score the pdfs are found using histogram representations of the
    data. The number of bins numBins controls how smoothly the pdf fits the actual distribution
    of events.
    '''

    def move_mean(x, window):
        xs = np.cumsum(x)
        x1 = xs[(window-1):]
        x2 = np.concatenate([[0], xs[:-window]])
        return np.concatenate([[np.nan]*(window-1), (x1-x2)/float(window)])

    neg,pos = neg[:,channelIndex].copy(),pos[:,channelIndex].copy()
    if numBins == None:
        numBins = int(np.sqrt(np.max([neg.shape[0],pos.shape[0]])))

    pdfNeg, bins = np.histogram(neg, bins=numBins, normed=True)
    pdfPos, bins = np.histogram(pos, bins=bins, normed=True)

    pdfNeg = move_mean(pdfNeg, window=width)
    pdfPos = move_mean(pdfPos, window=width)

    xs = (bins[:-1]+bins[1:])/2.0
    fscores,precision,recall = calculate_fscores(pdfNeg,pdfPos,beta=beta,theta=theta)
    fThreshold = xs[np.argmax(fscores)]

    return {'threshold':fThreshold, 'fscores':fscores,'pdfx':xs,'pdfpos':pdfPos,'pdfneg':pdfNeg,
            'precision':precision,'recall':recall}
Calculate fscore
The f-score is calculated as show in Eqn (?). The TP, FP an FN are estimated from the overlayed pdfs that represent the positive and negative event distributions.
def calculate_fscores(neg_pdf,pos_pdf,beta=0.2,theta=3.0):
    n = len(neg_pdf)
    fpos = np.where(pos_pdf > theta*neg_pdf, pos_pdf-neg_pdf, 0)
    tp = np.array([np.sum(fpos[i:]) for i in range(n)])
    fn = np.array([np.sum(fpos[:i]) for i in range(n)])
    fp = np.array([np.sum(neg_pdf[i:]) for i in range(n)])
    precision = tp/(tp+fp)
    precision[tp==0]=0
    recall = tp/(tp+fn)
    recall[recall==0]=0
    fscores = (1+beta*beta)*(precision*recall)/(beta*beta*precision + recall)
    fscores[np.where(np.isnan(fscores)==True)[0]]=0

return fscores,precision,recall
Get cytokine positive events
Using the fscore threshold we next use the following function to return the percentages, counts and indices of cytokine positive events
def get_cytokine_positive_events(cytoIndex,fThreshold,fileList,fcsList):
    percentages = {}
    counts = {}
    idx = {}
    filterInds = np.array([])

    for fileName in fileList:
        events = get_events(fileName,fileList,fcsList)
        data = events[:,cytoIndex]
        positiveEventInds = np.where(data > fThreshold)[0]

        if events.shape[0] == 0 or len(positiveEventInds) == 0:
           percentages[fileName] = 0.0
        else:
            percentages[fileName] = (float(positiveEventInds.size)/float(events.shape[0])) * 100.0
        counts[fileName] = positiveEventInds.size
        idx[fileName] = positiveEventInds

return percentages, counts, idx