
Research
Extracting Reynolds stresses from ADCP measurements in wave-dominated environments
ROSMAN, J. H., J. L. HENCH, J. R. KOSEFF, and S. G. MONISMITH, 2008. Extracting Reynolds stresses from acoustic Doppler current profiler measurements in wave-dominated environments. Journal of Atmospheric and Oceanic Technology, 25 (2): 286-306.
Abstract
Surface waves introduce velocity correlations that bias, and often dominate, Reynolds stress estimates made using the traditional variance method for ADCPs. Our analysis shows that the wave bias is the sum of a real wave stress and an error due to instrument tilt, which both have a large uncertainty. We propose and analyze three alternative extensions to the variance method, for calculating Reynolds stress profiles from ADCP measurements in wavy conditions. We evaluate a previously proposed variance fitting method (Variance Fit) and derive two more general methods that use along- and between-beam velocity differencing with adaptive filtering (Vertical AF and Horizontal AF). The three methods are tested on data sets containing long-period monochromatic swell (Moorea, French Polynesia), and shorter-period mixed swell (Santa Barbara, California). As predicted from our analysis, the Variance Fit method leaves a residual wave bias in beam velocity variances, especially for intermediate waves, but gives physically reasonable Reynolds stress estimates because most of the residual wave bias cancels when the variance method is applied. The new Vertical AF method does not produce inherent wave bias in beam velocity variances, but yields comparable Reynolds stresses to the Variance Fit method. The Horizontal AF method performs poorly for all but monochromatic waves. Error remaining after one of the above methods is applied can be attributed to residual wave error, correlation of turbulence between points chosen for differencing, or correlation between waves and turbulence. We provide a simple procedure for determining the minimum bin separation that can be used.
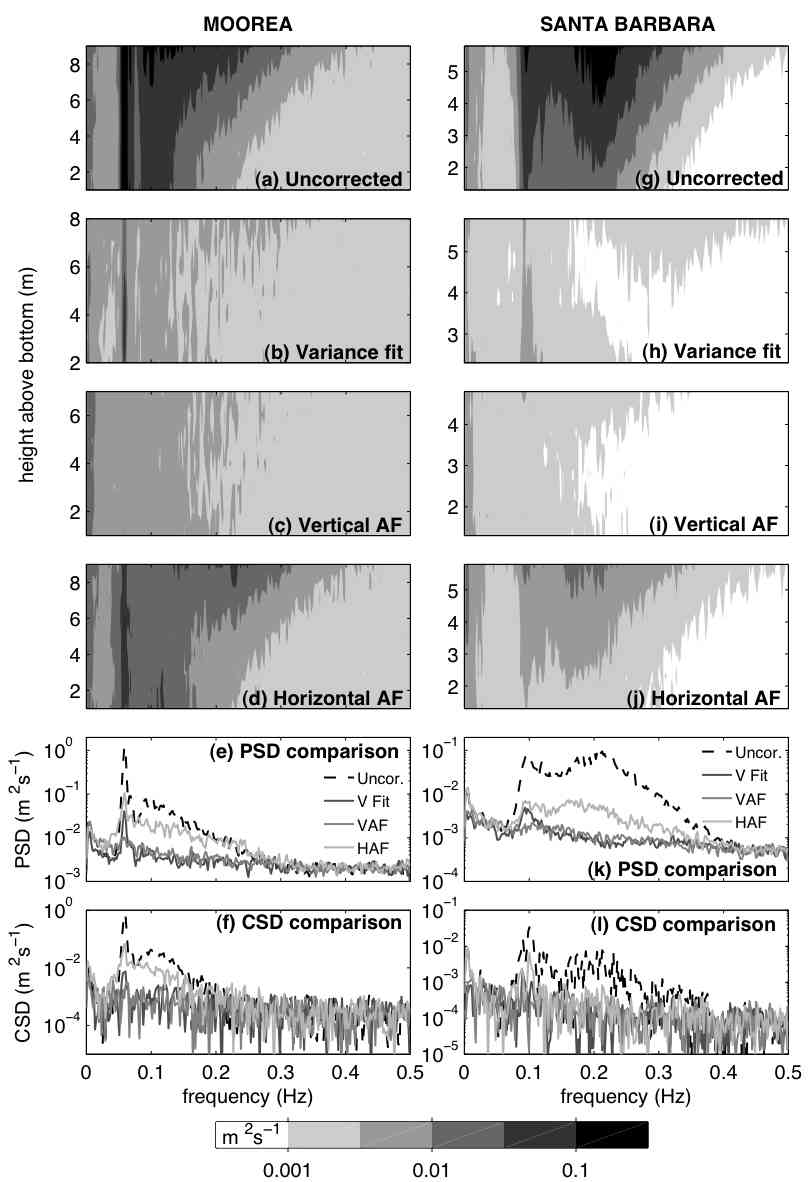
Figure showing the effects of different velocity differencing methods on beam velocity power spectra: (a,b,c,d,g,h,i,j) power spectra of beam 3 velocities (read across) and their variation with height above bottom (read upwards) for a 3 hour time period when wave amplitude was large, (e,k) line graphs of power spectra at mid-water column, (f,l) line graphs of the co-spectra at mid water-column.