In [1]:
import numpy as np
import pandas as pd
import matplotlib
import matplotlib.pyplot as plt
import seaborn as sns
%matplotlib inline

%load_ext version_information
%load_ext rpy2.ipython
Types of Plots
In [2]:
import warnings
warnings.filterwarnings("ignore")
In [3]:
url = 'http://bit.ly/2b72LNj'
df = pd.read_csv(url)
In [4]:
df.head()
Out[4]:
| model | mpg | cyl | disp | hp | drat | wt | qsec | vs | am | gear | carb | |
|---|---|---|---|---|---|---|---|---|---|---|---|---|
| 0 | Mazda RX4 | 21.0 | 6 | 160.0 | 110 | 3.90 | 2.620 | 16.46 | 0 | 1 | 4 | 4 |
| 1 | Mazda RX4 Wag | 21.0 | 6 | 160.0 | 110 | 3.90 | 2.875 | 17.02 | 0 | 1 | 4 | 4 |
| 2 | Datsun 710 | 22.8 | 4 | 108.0 | 93 | 3.85 | 2.320 | 18.61 | 1 | 1 | 4 | 1 |
| 3 | Hornet 4 Drive | 21.4 | 6 | 258.0 | 110 | 3.08 | 3.215 | 19.44 | 1 | 0 | 3 | 1 |
| 4 | Hornet Sportabout | 18.7 | 8 | 360.0 | 175 | 3.15 | 3.440 | 17.02 | 0 | 0 | 3 | 2 |
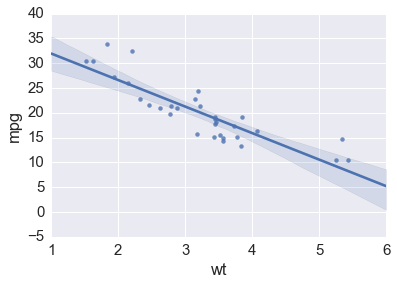
Fitting a regression line
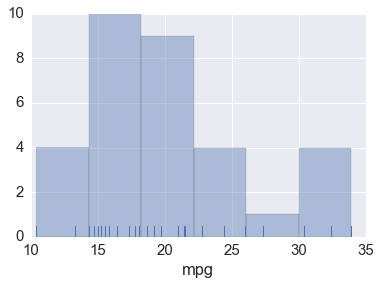
Histogram
In [13]:
sns.distplot(df.mpg, kde=False, rug=True)
Out[13]:
<matplotlib.axes._subplots.AxesSubplot at 0x1203a35f8>
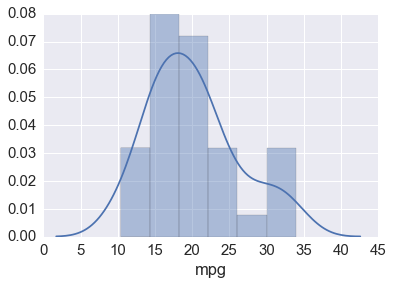
Density plot
In [14]:
sns.distplot(df.mpg)
Out[14]:
<matplotlib.axes._subplots.AxesSubplot at 0x12068a8d0>
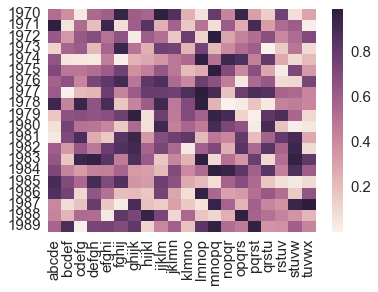
Heatmap
In [15]:
import string
In [16]:
nrows = 20
ncols = 20
row_names = range(1970, 1970 + nrows)
col_names = [string.ascii_lowercase[i:i+5] for i in range(ncols)]
values = np.random.random((nrows, ncols))
In [17]:
df = pd.DataFrame(values, index = row_names, columns = col_names)
In [18]:
sns.heatmap(df)
pass
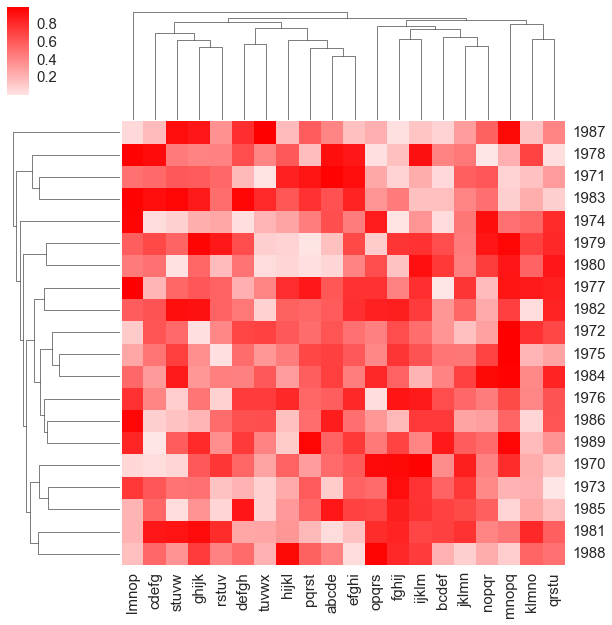
In [19]:
cmap = sns.light_palette('red', as_cmap=True)
g = sns.clustermap(df, cmap = cmap)
plt.setp(g.ax_heatmap.yaxis.get_majorticklabels(), rotation=0)
pass
Exercises
In [ ]:
Version information
In [20]:
%load_ext version_information
%version_information
The version_information extension is already loaded. To reload it, use:
  %reload_ext version_information
Out[20]:
| Software | Version |
|---|---|
| Python | 3.5.2 64bit [GCC 4.2.1 Compatible Apple LLVM 4.2 (clang-425.0.28)] |
| IPython | 5.0.0 |
| OS | Darwin 15.6.0 x86_64 i386 64bit |
| Tue Aug 16 09:05:23 2016 EDT | |
In [ ]: