- Note on "Additional Files."
In order to keep your browser from opening these files (in order that
you will have the option of directly saving them to disk) I have appended
the ".exe" file extension to some files that are NOT executables.
For these files, please choose "save to disk" and change the
name of the file extension as indicated. These are not executable files.
- Note on reusing source code.
You cannot simply cut-and-paste event handlers
into your Borland project. You must allow Borland C++ Builder
to create the event handlers for each of the components. After you have
done that, you may cut-and-paste the blocks of source code inside the
handler that Borland created.
|
|

|
|

|
|
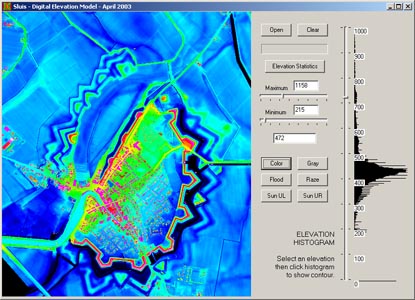 |
Sluis Digital Elevation Model
- 2003
A largely "new and
improved" version of the 2002 application below. The image is finally turned
right side up. An improved "faux shadows" algorithm is included with two "sun"
positions. The coloring of shadows or highlights is calculated with a simple algorithm. e.g. For the sun at upper left: If the cell to the upper left is higher than the current cell, the current cell is colored in dark grays. If it is lower, the current cell is colored in lighter grays. The coloring is done using a grayRamp() function. , New features are an elevation histogram with the option of
choosing to stretch the colorRamp() across any contour interval as well as "flood" and
"raze" simulations which progressively color contours from the
bottom up and top down, respectively. The data file is included as a .exe
(to keep the browser from opening it) and the extension must be changed to .txt before it is imported into the application.
|
|
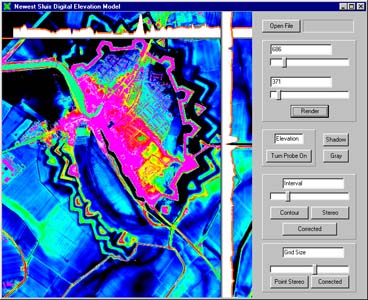 |
Sluis Digital Elevation Model
- 2002
This digital elevation
model (DEM) is taken from laser-scanned topography of an ancient fortified
town in the Netherlands. This application manipulates the elevations in
various ways rendering the elevations with an adjustable color ramp, with
contours and with two different algorithms for producing a 3D red/blue
color analglyph. The data file is included as a large text file.
|
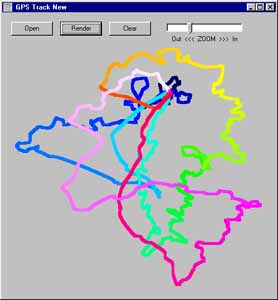 |
GPS Tracking
A program that will display a track recorded by a
portable GPS unit using color to represent the position at any time during
the travel.
Track Data Files - These provide
the tracking information for the visualization. Save them to your local
computer and open them in the Windows application.
Miscellaneous Tracks
|
ATSAC Tracks
|
|
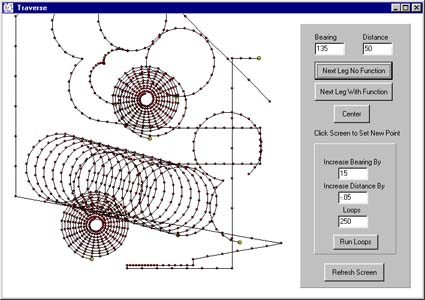 |
Traverse
This application simulates
the mapping practice of surveying a traverse across land. Picking a starting
point, travelling a given compass bearing a given distance defines the
first leg of the traverse and the next turning point or hub. The application
shows how that point may be computed directly, how it may be encapsulated
in a function, and how that function may be called recursively.
|
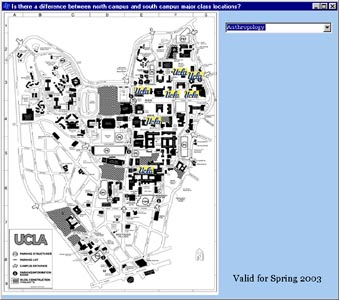 |
Pam's UCLA Map
Shows the location of classes offered by various departments
at UCLA. This application makes extensive use of the ComboBox as well
as bitmap images of the campus and several UCLA logos.
Executable |
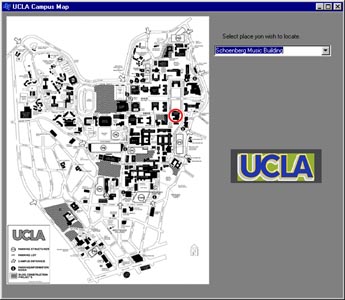 |
Ryan's UCLA Map
Shows the location of the major buildings and features
at UCLA. This application makes
extensive use of the ComboBox as well as bitmap images of the campus and
a transparent red circle.
Executable |
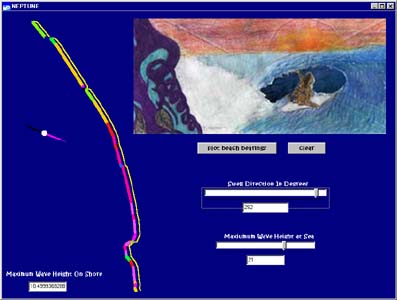 |
Bilandra's "Neptune"
Calculates and displays the wave height of Southern
California beaches given the wave height at sea and the wind direction.
The wave height is colored from black (low) through blue, cyan, green,
yellow, orange, red, magenta and white (high). This color ramp function
is described on our graphics page as "color scale."
Executable |
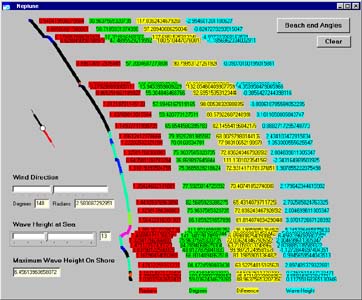 |
"Neptune" an Early Version
An early version of Bilandra's "Neptune"
showing the use of visualization to help in debugging the application.
The excessive amount of data that is visible was used to check the proper
operation of the program. In the final version it was removed.
|
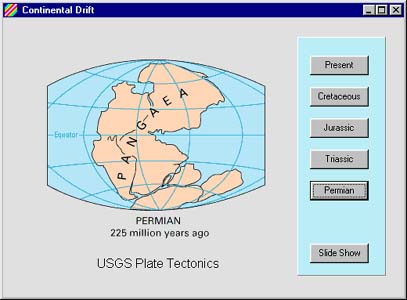 |
Continental Drift
This slide-show animation
of plate tectonics illustrates the use of bitmap images and their visible
and transparent properties. By default the transparent color is the color
of the extreme lower-left pixel but it can be set to any other color.
Transparency and drawing to an image only works with
.bmp bitmaps. The system timer is also used to change slides automatically.
The Internet link is one of the Ziegler components.
|
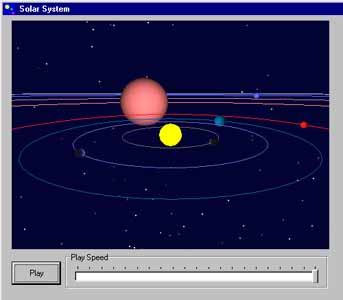 |
Open Graphic Language (OGL) -
Solar System
This application, from
the C++ BUILDER 5 DEVELOPERS' GUIDE simulates the motions of the planets
in the solar system. There is no representation of mass or gravity; only
the circular orbits are represented following predetermined rotations.
Nevertheless this is a good introduction to OpenGL (the Open Graphical
Language) which we can use to develop visualizations from our simulations
and cartographic projects.
Executable
Source Code
|

