 How to choose forecasting models
Steps in choosing a
forecasting model
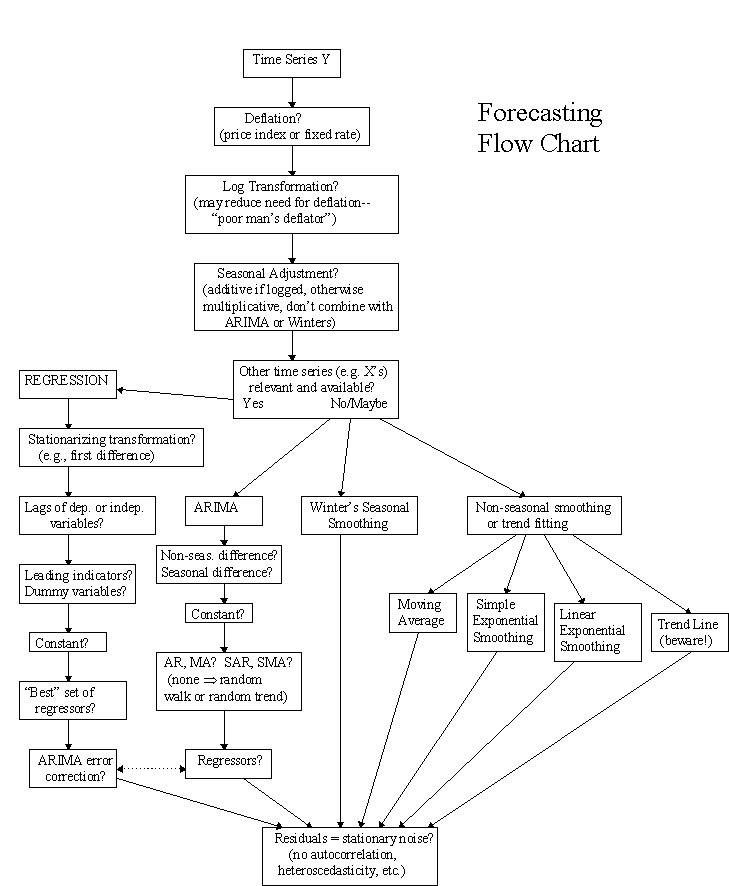
Forecasting flow chart
Data transformations and forecasting models: what to use
and when
Automatic forecasting software
Political and ethical issues in
forecasting
How to avoid trouble: principles of good data analysis
Steps in choosing a forecasting model
Your
forecasting model should include features which capture all the important
qualitative properties of the data: patterns of variation in level and trend,
effects of inflation and seasonality, correlations among variables, etc.. Moreover, the assumptions which underlie
your chosen model should agree with your intuition about how the series is
likely to behave in the future. When fitting a forecasting model, you have some
of the following choices:
Deflation?
Log transformation?
Seasonal adjustment?
Independent variables?
Smoothing, averaging, or random walk?
Winters seasonal smoothing?
ARIMA?
These
options are briefly described below. See the accompanying Forecasting
Flow Chart for a pictorial view of the model-specification process, and
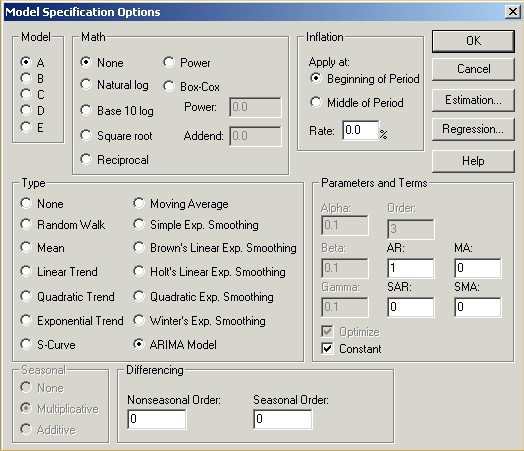
refer back to the Statgraphics Model Specification panel
to see how the model features are selected in the software.
Deflation?
If
the series shows inflationary growth, then deflation
will help to account for the growth pattern and reduce heteroscedasticity in
the residuals. You can either (i) deflate the past data and reinflate the
long-term forecasts at a constant assumed rate, or (ii) deflate the past data
by a price index such as the CPI, and then "manually" reinflate the
long-term forecasts using a forecast of the price index. Option (i) is the
easiest. In Excel, you can just
create a column of formulas to divide the original values by the appropriate
factors. For example, if the data is monthly and you want to deflate at a rate
of 5% per 12 months, you would divide by a factor of (1.05)^(k/12) where k is
the row index (observation number).
RegressIt and Statgraphics have built-in tools that do this
automatically for you. If you go this route, it is usually best to set the
assumed inflation rate equal to your best estimate of the current rate, particularly if you are going to forecast more than
one period ahead. If instead you choose option (ii), you must first save the
deflated forecasts and confidence limits to your data spreadsheet, then
generate and save a forecast for the price index, and finally multiply the
appropriate columns together. (Return to top of page.)
Logarithm
transformation? If
the series shows compound growth and/or a multiplicative seasonal pattern, a logarithm transformation may be helpful in addition to or
lieu of deflation. Logging the data will not flatten an inflationary growth
pattern, but it will straighten it out it so that it can be fitted by a linear
model (e.g., a random walk or ARIMA model with constant growth, or a linear
exponential smoothing model). Also, logging will convert multiplicative
seasonal patterns to additive patterns, so that if you perform seasonal
adjustment after logging, you should use the additive type. Logging deals with
inflation in an implicit manner; if you want inflation to be modeled
explicitly--i.e., if you want the inflation rate to be a visible parameter of
the model or if you want to view plots of deflated data--then you should
deflate rather than log.
Another
important use for the log transformation is linearizing
relationships among variables in a regression model. For example, if the dependent variable
is a multiplicative rather than
additive function of the independent variables, or if the relationship between
dependent and independent variables is linear in terms of percentage changes rather than absolute changes, then applying a
log transformation to one or more variables may be appropriate, as in the beer sales example. (Return to top of page.)
Seasonal
adjustment?
If the series has a strong seasonal pattern which is believed to be constant
from year to year, seasonal adjustment may be an
appropriate way to estimate and extrapolate the pattern. The advantage of
seasonal adjustment is that it models the seasonal pattern explicitly, giving
you the option of studying the seasonal indices and the seasonally adjusted data.
The disadvantage is that it requires the estimation of a large number of
additional parameters (particularly for monthly data), and it provides no
theoretical rationale for the calculation of "correct" confidence
intervals. Out-of-sample validation is especially important to reduce the risk
of over-fitting the past data through seasonal adjustment. If the data is
strongly seasonal but you do not choose seasonal adjustment, the alternatives
are to either (i) use a seasonal
ARIMA model, which implicitly forecasts the seasonal pattern using seasonal
lags and differences, or (ii) use the Winters
seasonal exponential smoothing model, which estimates time-varying seasonal
indices. (Return to top of page.)
"Independent"
variables? If
there are other time series which you believe to have explanatory power with
respect to your series of interest (e.g., leading economic indicators or policy
variables such as price, advertising, promotions, etc.) you may wish to
consider regression as your
model type. Whether or not you choose regression, you still need to consider
the possibilies mentioned above for transforming your variables (deflation,
log, seasonal adjustment--and perhaps also differencing) so as to exploit the
time dimension and/or linearize the relationships. Even if you do not choose
regression at this point, you may wish to consider adding regressors later to a
time-series model (e.g., an ARIMA model) if the residuals turn out to have
signficant cross-correlations with other variables. (Return to
top of page.)
Smoothing,
averaging, or random walk? If you have chosen to seasonally adjust the data--or
if the data are not seasonal to begin with--then you may wish to use an averaging or smoothing model
to fit the nonseasonal pattern which remains in the data at this point. A simple
moving average or simple exponential smoothing model merely computes
a local average of data at the end of the series, on the assumption that this
is the best estimate of the current mean value around which the data are
fluctuating. (These models assume that the mean of the series is varying slowly
and randomly without persistent trends.) Simple exponential smoothing is
normally preferred to a simple moving average, because its exponentially
weighted average does a more sensible job of discounting the older data,
because its smoothing parameter (alpha) is continuous and can be readily
optimized, and because it has an underlying theoretical basis for computing
confidence intervals.
If
smoothing or averaging does not seem to be helpful--i.e., if the best predictor
of the next value of the time series is simply its previous value--then a random walk model is indicated. This is the case, for
example, if the optimal number of terms in the simple moving average turns out
to be 1, or if the optimal value of alpha in simple exponential smoothing turns
out to be 0.9999.
Brown's linear
exponential smoothing can be used to fit a series with slowly time-varying
linear trends, but be cautious about extrapolating such trends very far into
the future. (The rapidly-widening confidence intervals for this model testify
to its uncertainty about the distant future.) Holt's linear smoothing
also estimates time-varying trends, but uses separate parameters for smoothing
the level and trend, which usually provides a better fit to the data than
Brown’s model. Quadratic exponential smoothing
attempts to estimate time-varying quadratic trends, and should virtually
never be used. (This would correspond to an ARIMA model with three
orders of nonseasonal differencing.)
Linear exponential smoothing with a
damped trend (i.e., a trend
that flattens out at distant horizons) is often recommended in situations where
the future is very uncertain.
The
various exponential smoothing models are special cases of ARIMA models (described below) and can be fitted with ARIMA
software. In particular, the simple
exponential smoothing model is an ARIMA(0,1,1) model, Holt’s linear
smoothing model is an ARIMA(0,2,2) model, and the damped trend model is an
ARIMA(1,1,2) model. A good summary
of the equations of the various exponential smoothing models can be found in this
page on the SAS web site. (The
SAS menus for specifying time series models are also shown there—they are
similiar to the ones in Statgraphics.)
Linear,
quadratic, or exponential trend line models are
other options for extrapolating a deseasonalized series, but they rarely
outperform random walk, smoothing, or ARIMA models on business data. (Return to top of page.)
Winters
Seasonal Exponential Smoothing? Winters
Seasonal Smoothing is an extension of exponential smoothing that
simultaneously estimates time-varying level, trend, and seasonal factors using
recursive equations. (Thus, if you use this model, you would not first
seasonally adjust the data.) The Winters seasonal factors can be either
multiplicative or additive: normally you should choose the multiplicative
option unless you have logged the data. Although the Winters model is clever
and reasonably intuitive, it can be tricky to apply in practice: it has three
smoothing parameters--alpha, beta, and gamma--for separately smoothing the
level, trend, and seasonal factors, which must be estimated simultaneously.
Determination of starting values for the seasonal indices can be done by
applying the ratio-to-moving average method of seasonal adjustment to part or
all of the series and/or by backforecasting. The estimation algorithm that
Statgraphics uses for these parameters sometimes fails to converge and/or
yields values which give bizarre-looking forecasts and confidence intervals, so
I would recommend caution when using this model. (Return to top of page.)
ARIMA? If you do not
choose seasonal adjustment (or if the data are non-seasonal), you may wish to
use the ARIMA model framework. ARIMA models are a very general class of
models that includes random walk, random trend, exponential smoothing, and
autoregressive models as special cases. The conventional wisdom is that a
series is a good candidate for an ARIMA model if (i) it can be stationarized by a combination of differencing and other
mathematical transformations such as logging, and (ii) you have a substantial
amount of data to work with: at least 4 full seasons in the case of seasonal
data. (If the series cannot be adequately stationarized by differencing--e.g.,
if it is very irregular or seems to be qualitatively changing its behavior over
time--or if you have fewer than 4 seasons of data, then you might be better off
with a model that uses seasonal adjustment and some kind of simple averaging or
smoothing.)
ARIMA
models have a special naming convention introduced by Box and Jenkins. An nonseasonal ARIMA model is classified
as an ARIMA(p,d,q) model, where d is
the number of nonseasonal differences, p is the number of autoregressive terms
(lags of the differenced series), and q is the number of moving-average terms
(lags of the forecast errors) in the prediction equation. A seasonal ARIMA model is classified as an
ARIMA(p,d,q)x(P,D,Q), where D, P,
and Q are, respectively, the number of seasonal differences, seasonal
autoregressive terms (lags of the differenced series at multiples of the
seasonal period), and seasonal moving average terms (lags of the forecast errors
at multiples of the seasonal period).
The first
step in fitting an ARIMA model is to determine the appropriate order of
differencing needed to stationarize the series and remove the gross
features of seasonality. This is equivalent to determining which
"naive" random-walk or random-trend model provides the best starting
point. Do not attempt to use more than 2 total orders of differencing
(non-seasonal and seasonal combined), and do not use more than 1 seasonal
difference.
The second
step is to determine whether to include a constant term in the model:
usually you do include a constant term if the total order of
differencing is 1 or less, otherwise you don't. In a model with one order of
differencing, the constant term represents the average trend in the
forecasts. In a model with two orders of differencing, the trend in the
forecasts is determined by the local trend observed at the end of the time
series, and the constant term represents the trend-in-the-trend, i.e., the curvature
of the long-term forecasts. Normally it is dangerous to extrapolate
trends-in-trends, so you suppress the contant term in this case.
The third
step is to choose the numbers of autoregressive
and moving average parameters (p, d, q, P, D, Q) that are needed to
eliminate any autocorrelation that remains in the residuals of the naive model
(i.e., any correlation that remains after mere differencing). These numbers
determine the number of lags of the differenced series and/or lags of the
forecast errors that are included in the forecasting equation. If there is no
significant autocorrelation in the residuals at this point, then STOP, you're
done: the best model is a naive model!
If there
is significant autocorrelation at lags 1 or 2, you should try setting q=1 if
one of the following applies: (i) there is a non-seasonal difference in
the model, (ii) the lag 1 autocorrelation is negative, and/or (iii) the
residual autocorrelation plot is cleaner-looking (fewer, more isolated
spikes) than the residual partial autocorrelation plot. If there is no
non-seasonal difference in the model and/or the lag 1 autocorrelation is positive
and/or the residual partial autocorrelation plot looks cleaner, then try
p=1. (Sometimes these rules for choosing between p=1 and q=1 conflict with each
other, in which case it probably doesn't make much difference which one you
use. Try them both and compare.) If there is autocorrelation at lag 2 that is
not removed by setting p=1 or q=1, you can then try p=2 or q=2, or occasionally
p=1 and q=1. More rarely you
may encounter situations in which p=2 or 3 and
q=1, or vice versa, yields the best results. It is very strongly recommended that you not use p>1 and
q>1 in the same model. In
general, when fitting ARIMA models, you should avoid increasing model
complexity in order to obtain only tiny further improvements in the error stats
or the appearance of the ACF and PACF plots. Also, in a model with both p>1
and q>1, there is a good possibility of redundancy and non-uniqueness
between the AR and MA sides of the model, as explained in the notes on the mathematical
structure of ARIMA models. It
is usually better to proceed in a forward stepwise rather than backward
stepwise fashion when tweaking the model specifications: start with simpler models and only add
more terms if there is a clear need.
The same
rules apply to the number of seasonal autoregressive
terms (P) and the number of seasonal moving average terms (Q) with respect to
autocorrelation at the seasonal period (e.g., lag 12 for monthly data). Try Q=1
if there is already a seasonal difference in the model and/or the
seasonal autocorrelation is negative and/or the residual autocorrelation
plot looks cleaner in the vicinity of the seasonal lag; otherwise try P=1. (If it is logical for the series to
exhibit strong seasonality, then you must
use a seasonal difference, otherwise the seasonal pattern will fade out when
making long-term forecasts.)
Occasionally you may wish to try P=2 and Q=0 or vice versa, or
P=Q=1. However, it is very strongly recommended that P+Q should never be greater than
2. Seasonal patterns rarely
have the sort of perfect regularity over a large enough number of seasons that
would make it possible to reliably identify and estimate that many parameters. Also, the backforecasting algorithm that
is used in parameter estimation is likely to produce unreliable (or even crazy)
results when the number of seasons of data is not significantly larger than
P+D+Q. I would recommend no less
than P+D+Q+2 full seasons, and more
is better. Again, when fitting ARIMA models, you should be careful to avoid
over-fitting the data, despite the fact that it can be a lot of fun once you
get the hang of it.
Important special cases: As noted above, an ARIMA(0,1,1) model without
constant is identical to a simple exponential smoothing model, and it assumes a
floating level (i.e., no mean reversion) but with zero long-term trend. An ARIMA(0,1,1) model with
constant is a simple exponential smoothing model with a nonzero linear trend
term included. An ARIMA(0,2,1) or (0,2,2) model without constant is a
linear exponential smoothing model that allows for a time-varying trend. An ARIMA(1,1,2)
model without constant is a linear exponential smoothing model with damped
trend, i.e., a trend that eventually flattens out in longer-term
forecasts.
The most
common seasonal ARIMA models are the ARIMA(0,1,1)x(0,1,1)
model without constant and the ARIMA(1,0,1)x(0,1,1) model with constant. The former of these models basically
applies exponential smoothing to both the nonseasonal and seasonal components
of the pattern in the data while allowing for a time-varying trend, and the
latter model is somewhat similar but assumes a constant linear trend and
therefore a bit more long-term predictability. You should always include these two
models among your lineup of suspects when fitting data with consistent seasonal
patterns. One of them (perhaps with a minor variation such increasing p or q by
1 and/or setting P=1 as well as Q=1) is quite often the best. (Return to top of page.)