Capstone Example
Analysing cytokine array data
In this final example, we will write a program to extract potentially useful summaries of data from a cytokine assay kindly donated by Herman Staats. You can download the file from the Data Samples page. As you can see, real world data analysis is far more messy than we have let on so far. Suppose we want to do two things - display the distribution of each cytokine on diffeerent days to see changes over time, and generate some QC summaries on what errors are associated with what samples. Doing this manually in Excel will certainly be painful - what if Herman had stashed away hundreds of such files and wanted to perform the analysis on every single one of them? A manual analysis might take weeks and will likely be ridden with errors as we grow increasingly bored and frustrated with the task.
So we will write a program to do this instead. The program will be quite challenging to write - we have broken the task down into subtasks, and your job is to write functions to execute each subtask. Please ask for help if you get stuck at any point - we recognize that this will be an extemely challenging problem for most of you. OK - let’s begin ...
First, we need to convert the spreadsheet into a plain text format by exporting it within Excel. The Data Samples page provides a tab delimited version exported from Excel; exporting to csv format is also fine if you prefer. (Note that Python modules to read and write Excel files are available - see http://www.python-excel.org/ and http://packages.python.org/openpyxl/ but as these were not covered in the workshop, we will continue to work with exported plain text files).
Notice that the data is arranged as a nice rectangular grid, with row 1 giving the header information, column 1 the sample names, and the rest the actual data values or various error messages. This suggests that we can use numpy arrays to manipulate the data, which will lead to a shorter program than the use of the csv module to parse every item. Notice also that there is a mixture of strings and numbers in the spreadsheet, and numpy only works with arrays of all the same type. Since strings can represent numbers but not vice versa, we will first load the data as an array of strings using the numpy loadtxt function. Our strategy is then to manipulate the data so that apart from the header (row 1) and sample (column 1) information, everything else is converted to an array of floats for statistical analysis and visualization.
Our first task is to read the file and convert to an array of strings, which can be done with the loadtxt function. We first see what loadtxt does:
In [4]: import numpy as np

In [5]: help(np.loadtxt);
Exercise
Write a function called read_table to load a tab delimited file as a numpy array using the numpy loadtxt function. The function should take a filename and an optional delimiter (e.g. ‘t’ for TDL and ‘,’ for CSV) as arguments, and return a numpy array of strings:
def read_table(filename, delimiter='\t'):
    # your code goes here and should return a numpy array of strings
Now that we have the table as a numpy array, let’s focus on converting the middle “data” portion into an array of floats. We need to somehow convert all those error or warning messages into numbers. One simple way to do thiis is to encode each unique message as a number that cannot be mistaken for a data value. Since concentrations are never negative, we will use the negative integers to encode the errors. But in order to do the encoding, we first need to find out what types of messages exist in the data set.
Exercise
Write a function that finds all the warnings in the table returned by the previous read_table function and returns a dictionary of {warning : code} where warning is a string (e.g. ‘Bead Issues’ or ‘UN’) and code is a negative number. Each unique warning should be given a different negative number. Basically we want to find all strings in the “data” part of the table, i.e. table[1:, 1:], and everytime we find a string, we shove it into the dictionary if it is not already there with a new negative number code:
def parse_warnings(table):
    # your code goes here and should return a dictionary of warnings
Next, let’s deal with the sample information in column 1, excluding row 1, column 1. We notice that the same sample name can occur on multiple rows - let’s create a dictionary whose key is the sample name, and whose value is the row number minus one (minus one because we want row number = 0 to index the first data row, not the header information).
Exercise
Complete the function:
def parse_samples(table):
    # your code goes here and should return a dictionary of lists of row numbers for each sample
Parsing the header information is slightly more challenging. We notice that two different pieces of information are provided by each cell in the header - the cytokine name (e.g. IL-2 beta) and the day the sample was taken (e.g. day 3). Each cytokine is sampled on multple days (0, 3 and 28). We want to create a dictionary that will tell us what column we can find the values for a given cytokine, day combination. One way to deal with the fact that the same cytokine is sampled on multiple days is to use a dictionary of dictionaries. In particular, we will construct a dictionary whose key is a cytokine name, and whose value is another dictionary. This other dictionary has a key representing the day, and a value representing the column number minus one for the (cytokine, day) combination.
Exercise
Complete the function:
def parse_headers(table):
    # your code goes here and should return a dictionary of dictionaries as described in the text
We finally get to convert the data from an array of strings to an array of floats. Replace all the warning messages with the code numbers, and return a new array of floats comprising the following subarray - table[1:, 1:].
Exercise
Complete the function:
def parse_data(table, warning_dict):
  # your code goes here and should return an array of floats containing values for the entries in table[1:, 1:]
Let’s consolidate all the above functions into a single function that when given a filename, reads the file and breaks it down into a sample dictionary, a cytokine dicitonary and a data array. My function is shown below - you only have to change the names to match the structures that you created:
def parse_cytokine_table(filename):
    # extract data and sample and cytokine mapping dictinaries from table
    table = read_table(filename)

    warning_dict = parse_warnings(table)
    sample_mapper = parse_samples(table)
    cytokine_mapper = parse_headers(table)
    data = parse_data(table, warning_dict)
    return warning_dict, sample_mapper, cytokine_mapper, data
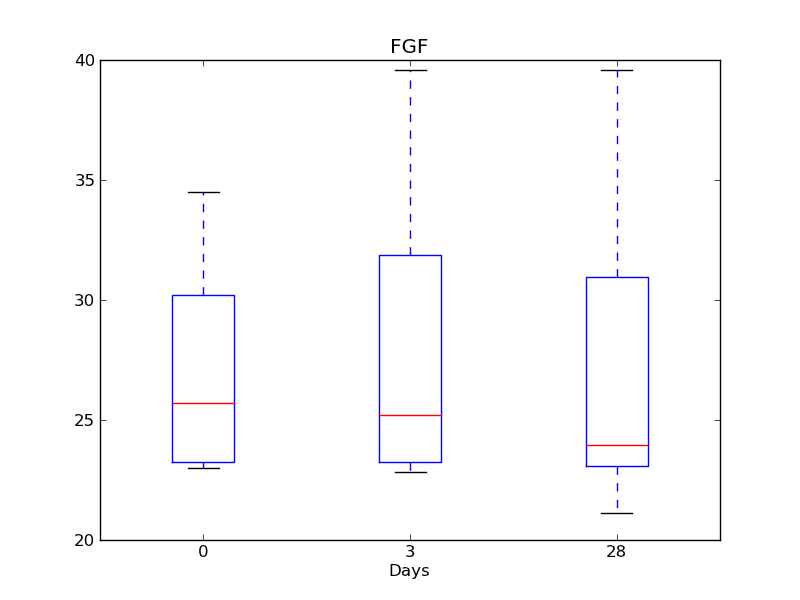
Well done! The most difficult part of the program is now complete. We next see how we can use the structures we have created to make summaries of the data. First, let’s use a box-and-whiskers plot to show the distribution of each cytokine over days 0, 3 and 28. Generate one such figure for each such cytokine - it should look something like this.
Exercise
Write the function to generate the box-and -whiskers plots. Remember that the negative numbers are not really cytokine concentrations and should not be used for plotting:
def plot_cytokine(cytokine, cytokine_mapper, data, save=False, directory='.'):
  # generate plots like the one shown
  # if save is False, don't save but simply show each figure
  # if save if True, save to disk with savefig(directory/filename)
Finally, let’s write the QC data to file. There seem to be an enormous number of errors in this file - let’s summarize them so that Herman can figure out what is going on! Generate one text file per unique warning, where each row has two columns - the sample name, and the number of that type of warning associated with the sample. For instance, the Bead_Issues.txt file will contain the following values:
0921-X-2-2    2
1059-X-2-2    12
0273-X-2-2    2
0740-X-2-2    4
0263-X-2-2    18
0175-X-2-2    2
0012-X-2-2    4
0108-X-2-2    1
0066-X-2-2    2
0057-X-2-2    12
0313-X-2-2    7
0103-X-2-2    25
0685-X-2-2    2
0799-X-2-2    4
0749-X-2-2    16
0693-X-2-2    1
1023-X-2-2    6
0300-X-2-2    2
Complete the function:
def write_qc(qc, directory='.'):
    # write QC reports as described
    # save to the directory given and use the mesage name + '.txt' as the filename
That wraps up the coding part of this final capstone example.
Final Exercise
Now that you know how to think like a programmer, don’t create such spreadsheets in the future if possible! Design spreadsheets so that the information is “machine-friendly”. What are some of the ways you can make the original spreadsheet more “machine-friendly” if you could change the design?
The full program that for parsing the cytokne assay file:
1 2 3 4 5 6 7 8 9 10 11 12 13 14 15 16 17 18 19 20 21 22 23 24 25 26 27 28 29 30 31 32 33 34 35 36 37 38 39 40 41 42 43 44 45 46 47 48 49 50 51 52 53 54 55 56 57 58 59 60 61 62 63 64 65 66 67 68 69 70 71 72 73 74 75 76 77 78 79 80 81 82 83 84 85 86 87 88 89 90 91 92 93 94 95 96 97 98 99 100 101 102 103 104 105 106 107 108 109 110 111 112 113 114 115 116 117 118 119 120 121 122 123 124 125 126 127 128 | """Intermediate example of data munging using numpy.
Task: Summarize the change in concentration over time for each cytokine.
Input: An Excel worksheet exported as a tab delimited file
Output: Figures summarizing concentrations of individual cytokines over time.
"""
import numpy
import pylab
import os
def parse_cytokine_table(filename):
# extract data and sample and cytokine mapping dictinaries from table
table = read_table(filename)
warning_dict = parse_warnings(table)
sample_mapper = parse_samples(table)
cytokine_mapper = parse_headers(table)
data = parse_data(table, warning_dict)
return warning_dict, sample_mapper, cytokine_mapper, data
def read_table(filename, delimiter='\t'):
# read data into an array of strings
# this can also be done by standard data munging techniques
# but would be more painful
return numpy.loadtxt(filename, dtype='string', delimiter=delimiter)
def parse_warnings(table):
# create a dictionary to convert missing data codes into numeric codes
data = table[1:, 1:]
warning_dict = {}
idx = -1
for x in data.ravel():
try:
float(x)
except:
if x not in warning_dict:
warning_dict[x] = idx
idx -= 1
return warning_dict
def parse_samples(table):
# create a dictionary that returns the rows where each sample has data
samples = table[1:,0]
sample_mapper = {}
for i, sample in enumerate(samples):
sample_mapper.setdefault(sample, []).append(i)
return sample_mapper
def parse_headers(table):
# get header information in first row
headers = table[0,:]
# parse header informtion to find columns for each cytokine/day combination
cytokine_mapper = {}
for i, label in enumerate(headers[1:]):
cytokine, day = label.split('day')
cytokine_mapper.setdefault(cytokine.strip(), {})[int(day)] = i
return cytokine_mapper
def parse_data(table, warning_dict):
# convert missing data from strings to code numbers for analysis
data = table[1:, 1:]
for warning in warning_dict:
data[data==warning] = warning_dict[warning]
data = data.astype('float')
return data
def plot_cytokine(cytokine, cytokine_mapper, data, save=False, directory='.'):
# generate box and whiskers plot for distribution of a single cytokine
idx_dict = cytokine_mapper[cytokine]
xs = data[:, sorted(idx_dict.values())]
# collect measured values for each day in a list ignoring missing values
ys = []
for i in range(xs.shape[1]):
col = xs[:,i]
ys.append(col[col >= 0])
# if there are any measured values, visualize the data disbution
if numpy.sum(len(y) for y in ys) > 0:
pylab.figure()
pylab.boxplot(ys)
pylab.xticks(range(1, len(idx_dict.keys())+1), idx_dict.keys())
pylab.xlabel('Days')
pylab.title(cytokine)
if save:
if not os.path.exists(directory):
os.makedirs(directory)
pylab.savefig(os.path.join(directory, cytokine + '.png'))
def sample_qc(warning_dict, sample_mapper, data):
# generate a dictionary whose keys are warning labels
# and whose values are lists of (sample, number of warnings) pairs
qc = {}
for warning in warning_dict:
for sample in sample_mapper:
idx = sample_mapper[sample]
xs = data[idx, :]
num_warnings = numpy.sum(xs==warning_dict[warning])
qc.setdefault(warning, []).append((sample, num_warnings))
return qc
def write_qc(qc, directory='.'):
if not os.path.exists(directory):
os.makedirs(directory)
for k in sorted(qc):
filename = k.replace(' ', '_').replace('/', '-') + '.txt'
fo = open(os.path.join(directory, filename), 'w')
sample_list = qc[k]
for sample in sample_list:
if sample[1] != 0:
fo.write('%s\t%d' % sample + '\n')
fo.close()
if __name__ == '__main__':
# parse the file
warning_dict, sample_mapper, cytokine_mapper, data = parse_cytokine_table(
'Cytokine_assay_31Dec08PAD.txt')
# visualize cytokine distributions
for cytokine in cytokine_mapper:
plot_cytokine(cytokine, cytokine_mapper, data,
save=True, directory='figures')
# Save errors by sample for QC to output files
qc = sample_qc(warning_dict, sample_mapper, data)
write_qc(qc, directory='qc_reports')
|