NumPy - arrays
Contents
The main object in NumPy is the homogeneous, multidimensional array. An array is a table of elements. An example is a matrix \(x\)
can be represented as
>>> import numpy as np
>>> x = np.array([[1,2,3],[4,5,6],[7,8,9]])
>>> x
array([[1, 2, 3],
       [4, 5, 6],
       [7, 8, 9]])
>>> x.shape
(3, 3)
The array \(x\) has 2 dimensions. In NumPy the number of dimensions is referred to as rank. The ndim is the same as the number of axes or the length of the output of x.shape
>>> x.ndim
2
>>> x.size
9
Arrays are convenient because of built in methods.
>>> x.sum(axis=0)
array([12, 15, 18])
>>> x.sum(axis=1)
array([ 6, 15, 24])
>>> x.mean(axis=0)
array([ 4.,  5.,  6.])
>>> x.mean(axis=1)
array([ 2.,  5.,  8.])
But arrays are also useful because they interact with other NumPy functions as well as being central to other package functionality. To make a sequence of numbers, similar to range in the Python standard library, we use arange.
>>> np.arange(10)
array([0, 1, 2, 3, 4, 5, 6, 7, 8, 9])
>>> np.arange(5,10)
array([5, 6, 7, 8, 9])
>>> np.arange(5,10,0.5)
array([ 5. ,  5.5,  6. ,  6.5,  7. ,  7.5,  8. ,  8.5,  9. ,  9.5])
Also we can recreate the first matrix by reshaping the output of arange.
>>> x = np.arange(1,10).reshape(3,3)
>>> x
array([[1, 2, 3],
       [4, 5, 6],
       [7, 8, 9]])
Another similar function to arange is linspace which fills a vector with evenly spaced variables for a specified interval.
>>> x = np.linspace(0,5,5)
>>> x
array([ 0.  ,  1.25,  2.5 ,  3.75,  5.  ])
As a reminder you may access the documentation at anytime using
~$ pydoc numpy.linspace
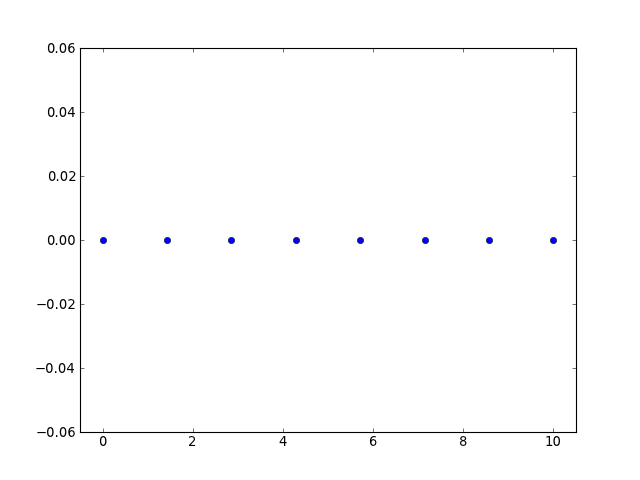
Visualizing linspace...
import numpy as np
import matplotlib.pyplot as plt
fig = plt.figure()
ax = fig.add_subplot(111)
N = 8
y = np.zeros(N)
x1 = np.linspace(0, 10, N, endpoint=True)
p1 = plt.plot(x1, y, 'o')
ax.set_xlim([-0.5,10.5])
plt.show()
(Source code, png, hires.png, pdf)

Arrays may be made of different types of data.
>>> x = np.array([1,2,3])
>>> x.dtype
dtype('int64')
>>> x = np.array([0.1,0.2,0.3])
>>> x
array([ 0.1,  0.2,  0.3])
>>> x.dtype
dtype('float64')
>>> x = np.array([1,2,3],dtype='float64')
>>> x.dtype
dtype('float64')
>>> x = np.zeros([3,4])
>>> x
array([[ 0.,  0.,  0.,  0.],
       [ 0.,  0.,  0.,  0.],
       [ 0.,  0.,  0.,  0.]])
>>> x = np.ones([3,4])
>>> x
array([[ 1.,  1.,  1.,  1.],
       [ 1.,  1.,  1.,  1.],
       [ 1.,  1.,  1.,  1.]])
Exercise
- Create the following array (1 line)
Use the array object to get the number of elements, rows and columns
Get the mean of the rows and columns
What do you get when you do this?
>>> a[4,:]
- [extra] If you have time you can get familiar try
- np.log(a)
- np.cumsum(a)
- np.rank(a)
- np.power(a,2)
[extra] How do you create a vector that has exactly 50 points and spans the range 11 to 23