Tools for data analysis
Reaction Complex Workbench
The term Reaction Complex is the name designated for an entity in Daphne that specifies a group of reactions. Typically, the group of reactions in the Reaction Complex represent a set of inter-related reactions that, as a whole, represent a certain process inside the cell or in the extracellular medium. In this workbench environment, the user can easily explore the dynamical behavior of sets of reactions occurring in a spatially homogeneous environment.
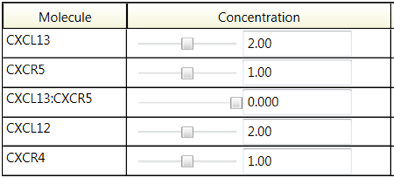
The main features of this workbench environment are the plots of the molecular trajectories (Figure 1) and the interactive controls. The user can change the initial concentration of a molecule with the slider (Figure 2), or by dragging the appropriate ‘yellow ball’ on the y-axis (Figure 1), and see the graph update in realtime. Similarly, the user can use a slider to change a reaction rate constant (Figure 2) and see the graph update in realtime. With this interactive environment, the user can rapidly explore the behavior space to determine suitable parameter values.
Cell population dynamics
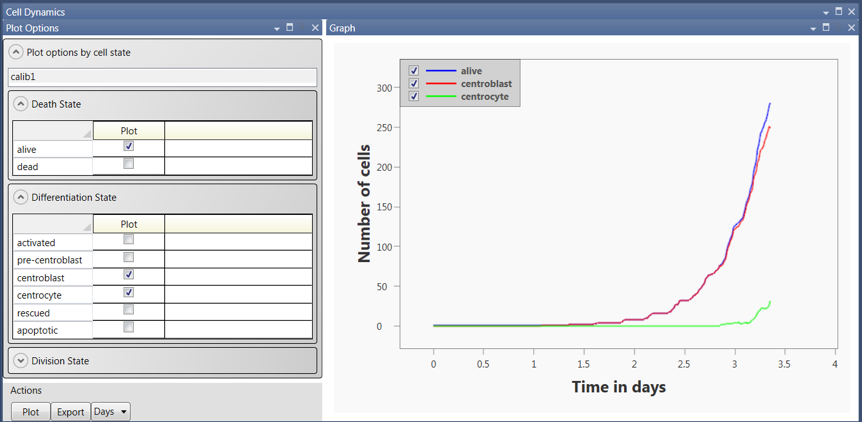
Figure 3 illustrates the capability available in the post-simulation analysis of cell population dynamics. In this type of analysis, the user select subsets of a cell population and plot the numbers of cells in the subset as a function of time. Cell subsets can be selected based on death, differentiation, or division states. The user can select the x-axis units (minutes, hours, days, or weeks) and can export plots to various common file types.

Figure 3: An example of the Cell Population Dynamics interface. The user can select subsets of cells to plot based on death, differentiation, or division states.In this example, the number of GC B cells that are alive (blue), in the centroblast state (red), and in the centrocyte state (green) are plotted as a function of the number of days from the start of the simulation.
Cell lineage analysis
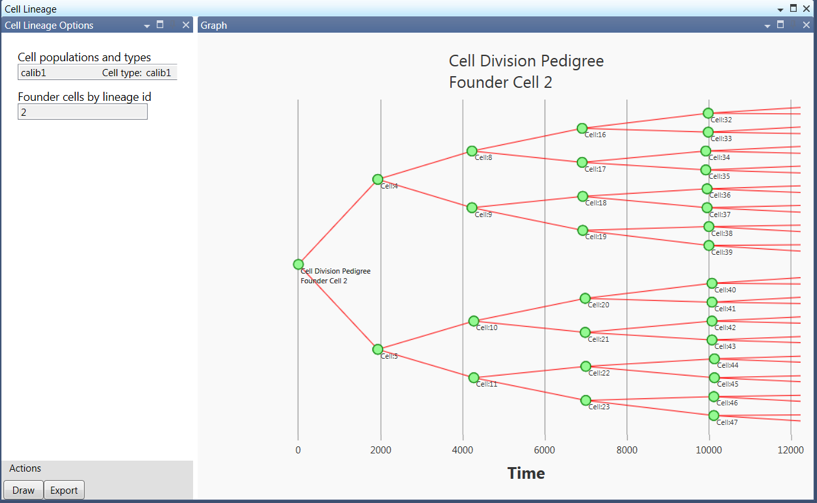
Figure 4 illustrates the capability available in the cell lineage analysis. In this type of analysis, the user select a cell population and a founder cell. Founder cells are defined to be cells present at the start of the simulation. The cell lineage for the founder cell is plotted. The user can export the plot to various common file types.
Cell tracks
The White Hand tool can also be used to display the trajectory of selected cells. An example of the cell track display is shown in Figure 5 for a cell that is has both chemotactic and random motion.


