Calibration
Gene Transcription
The gene transcription reactions are pseudo-reactions that encapsulate both transcription and translation. For example, the transcription reaction below produces CXCR4 molecules.
We can get a ballpark estimate of the rate constant k from data in the Schwanhausser et al. paper (Nature 2011 (473), 337-342) that measured mRNA transcription rates and protein translation rates in a wide variety of mammalian cells. Results from the paper are shown in the box below
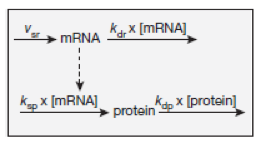
Figure 1: Data from [Schwanhausser2011]
From these data, the mean protein production rate is r = (17)(140)/60 = 40 copies/min. This corresponds to a per gene rate of υ=20 copies/(min- gene), since in Daphne we typically have two active copies of each gene.
For a 10 μm diameter cell, the volume is V=524 μm3. The mean rate constant for Daphne protein production reactions \(\lambda\) is,
This value can serve as a default transcription reaction rate for gene transcription in Daphne. Of course, more informed values can be used for individual cases, where more information is available, and the user can modify reaction rates, where desired.
Receptor Internalization
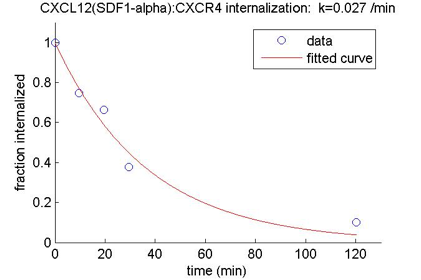
Data from the [Hesselgesser1998] and [Barroso2012] papers were used to obtain estimates for the rates of internalization of CXCl12:CXCR4 and CXCL13:CXCR5 complex.
| Molecule | rate const. 1/(um * min) | Reference |
|---|---|---|
| CXCL12(SDF1-\(\alpha\)):CXCR4 | 0.027 | [Hesselgesser1998] |
| CXCL13:CXCR5 | 0.01 | [Barroso2012]. |
Chemokine-Receptor Affinity
On/off rate values for CXCL12/CXCR4 and CXCL13/CXCR5 binding were found in papers by [Vega2011]. and [Barroso2012]. (Table 3).
| ECM reactions | rate constant | koff/kon (#/um^3) | measured | source |
|---|---|---|---|---|
| CXCL12 + CXCR4| -> CXCL12:CXCR4| | 0.042 | 11.67 | 20.9 | [Vega2011] |
| CXCL12:CXCR4| -> CXCL12 + CXCR4| | 0.49 | |||
| CXCL13 + CXCR5| -> CXCL13:CXCR5| | 0.0077 | 27.27 | 30.4 | [Barroso2012] |
| CXCL13:CXCR5| -> CXCL13 + CXCR5| | 0.21 |
Cell-cycle calibration
We calibrated a cell-cycle model in Daphne to data in the literature. We used published cell cycle data from the Hodgkin laboratory [Dowling2014]. In this work, cells were stimulated in vitro and cell-cycle times were measured using a transgenic system - Fluorescence Ubiquitination-based Cell Cycle Indicator (FUCCI). With this system they were able to accurately measure the total cell-cycle length and the length of the S/G2/M phase. The length of the G1 phase was inferred from these two measurements. A variety of cell types and stimulants were used, but this calibration work focused on CpG-stimulated B cells, as these seemed most relevant for germinal center dynamics.
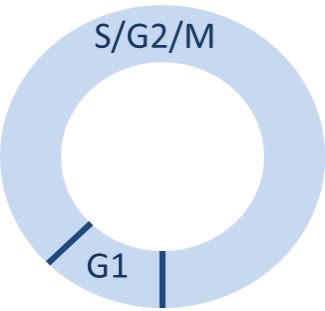
Because the experimental work of [Dowling2014] was only able to accurately measure the length of the combined S, G2, and M phases, we created a two-phase cell cycle model in Daphne, with the first phase representing the G1 phase and the second stage representing the combined S/G2/M phase. The cell undergoes cell division upon leaving the second (S/G2/M) phase and then immediately transitions back to the first (G1) (Figure 3).
In this model, the probability of transitioning out of phase i in time step δt is given by (?),
where κi is an order parameter and τi is a scale parameter. With these transition probabilities, the probability density functions for the transition times are given by Weibull distributions
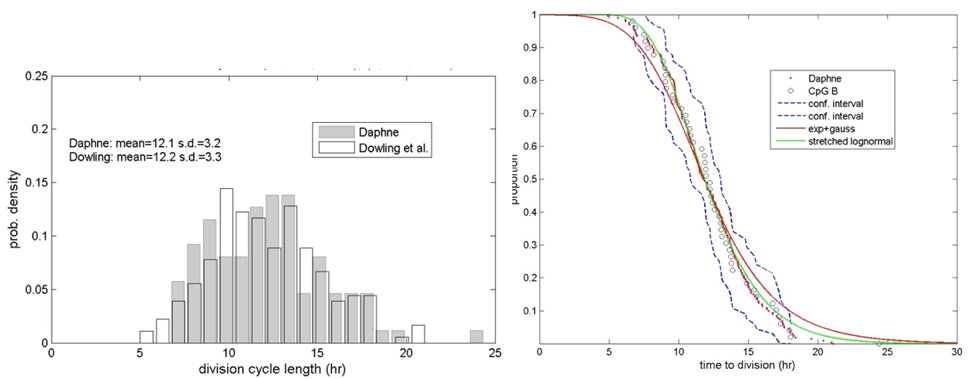
The Daphne cell-cycle model was fit to experimental measurements of division cycle length in CpG-stimulated B cells. Figure 4 shows a comparison of the experimentally-measured and Daphne-simulated division cycle length data. In the left panel, the probability density results are compared and we can see that the mean and variance of the simulated results (mean=12.1 hr, s.d.=3.2 hr) compare well to the experimental values (mean=12.2 hr, s.d.=3.3 hr). The data are plotted in an alpha-plot in the right panel. Plotting the data in this manner provides a more sensitive comparison of the tails of the distributions. In this plot the experimental data are plotted as open circles and the Daphne data are plotted as red dots. In this plot we can see that the Daphne data match the experimental data well, but that there is most discrepancy at the left tail of the data.
Stochastic Motion
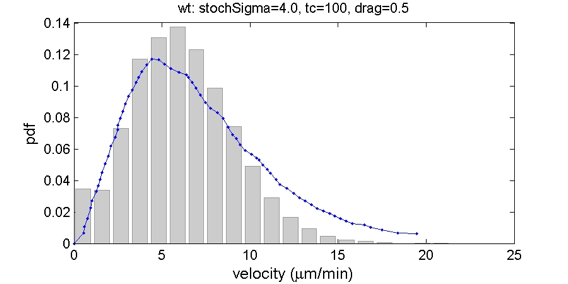
Stochastic cell motion in Daphne was calibrated to experimental data from [Allen2007] (Figure 5).
