3. 3 Energy Use
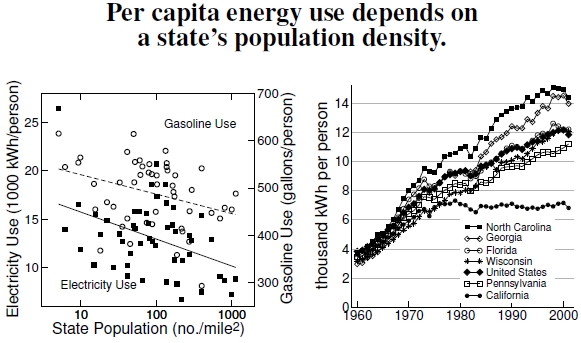
Figure 3.3: At left, gasoline and electricity use as a function of a state’s population density (excluding Alaska and the District of Columbia). Cities promote reduced per capita energy use, and, compared to the lowest density states, the highest density states use just 60% of the electricity and 80% of the fuel on a per capita basis. The right plot shows electricity use through time for selected states in the Southeast and California (after North Carolina Sustainable Energy Association).
Urbanization greatly helps us use energy more conservatively. Notice that Figure 3.2 shows how New Yorkers have very low gasoline use, undoubtedly because people in New York County, at 70,000 people per square mile, live without cars. Wyoming has the highest use, undoubtedly because its population is spread out over vast distances. Electricity use also reflects this pattern.
Testing this idea of whether a state’s population density influenced energy use, the left-hand graph in Figure 3.3 shows per capita gasoline and electricity use against a state’s population density.[16] The fitted lines demonstrate clear trends: People use more energy when they’re spread out.[17]
Two obvious mechanisms seem likely. First, people living closer together need less gasoline to go where other people are. Second, the closer people live to one another, the closer people are to electrical generating stations. For example, the low-population density of Wyoming probably means long transmission lines between electrical generation plants and homes, and more energy lost in electrical transmission. Long transmission lines have high line losses, bumping up the per capita energy use of low-density states.[18]
Over the last 50 years, people’s electricity use changed, more drastically in some states than others. The right-hand figure shows per capita electricity use in several states.[19] Consider the electricity used in North Carolina–about 14,400 kWh per year. As a personal example, my electric bill shows that over the last year my house has used about 10,000 kWh for four people, just one-sixth of the amount indicated per person. However, my electric bill doesn’t include the electricity used at my office, my wife’s office, my kids’ schools, and all of the other places we spend time. That use presumably amounts to 80% of our electrical energy demands. My family meets the household average: The U.S. Energy Information Agency reports that in 2001, 107 million households used 1.1 trillion kWh, working out to 11,000 kWh per household. Electrical energy conservation begins at home, but elsewhere lies the real impact.
By the looks of things, Californians have become energy-misers, but many factors like population density and climate factor in here, too. I’m uneasy comparing energy use between Los Angeles, for example, and agricultural areas of North Carolina. I’ve lived in both states, and I don’t begrudge North Carolinians their air conditioning as their socioeconomic conditions improved, for the health reasons I show later.
————————————
[16]The fits for the two datasets in Figure 3.3, per capita gasoline, and electricity use versus state area, are both significant, and have, respectively, R2 of 0.11 and 0.17; fitting the functional form, y = A − B ln(x), give As of 569.28 and 18,531, and Bs of -17.8 and -1,209.2.
[17]The idea that per capita energy use decreases with human density might not be borne out across all countries, however. During a talk in Bangalore, India, an audience member expressed surprise about this connection: In developing countries rural areas do not yet have electrical service (and perhaps have low fuel provisioning as well); thus they have little energy use. In contrast, the United States pushed rural electrification in the 1930s, a time when many European countries already had rural service. Thus, in that situation, per capita energy use increases with population density, and my results are conditioned on the assumption that everyone has access to the same energy resources.
[18]Unfortunately, the only information I could find about line loss was that electric companies allowed for a 7% loss due to transmission, but I found no information on variation across the country.
[19]State-level per capita electricity use can be found in the 2006 North Carolina Sustainable Energy Legislative Guide, prepared by the North Carolina Sustainable Energy Association, www.ncsustainableenergy.org.
