3. 7 Warmed Nature
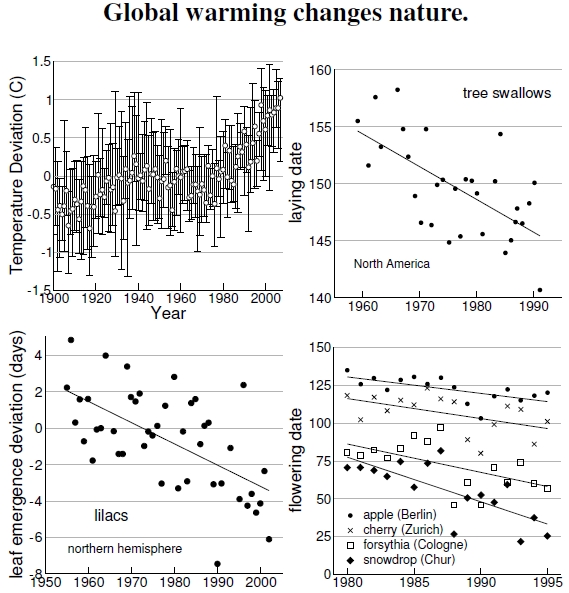
Figure 3.7: At top left, the graph shows the relative temperature change over the last century (after Brohan et al. 2006). The top plot measures a progressively earlier laying date for tree swallows across North America, amounting to about 10 days’ change over three decades (after Dunn and Winkler 1999). At bottom left, lilac leaves now emerge in the northern hemisphere about five days earlier than they did five decades ago (after Schwartz et al. 2006). At bottom right, several plant species in Europe flower one to three weeks earlier in the spring than they did just 15 years earlier (bottom right; after Roetzer et al. 2000).
We’ve just seen that temperature strongly correlates with CO2 levels, and increasing CO2 levels correlate with emissions (Figure 3.6). In the top left graph of Figure 3.7, I show the recent increasing global temperatures, which represents just one aspect of climate change,[36] to consider alongside the other three plots showing ecological changes. These plots examine the timing of life events, called phenology, caused by increased temperature and carbon dioxide.[37]
At top right, a massive study of almost 3,500 tree swallow nests, using data reported by a large network of ornithologists in North America, showed that the laying date has changed by nine days over a time span of a few decades. In this case, scientists suspect that warmer temperatures cause insects to emerge earlier in the season, the tree swallows eat these earlier available insects, obtaining enough resources in a shorter time, allowing them to lay their eggs earlier in the season.[38]
This earlier laying date might not be so bad for adult tree swallows, but this same effect for Parus major, a common British bird called the great tit, creates a problem because the earlier laying date also means an earlier hatching date. At that point it’s up to the adults to feed their offspring, but the chicks’ food source doesn’t change its development time. That leads to a mismatch between when the young hatch and when their food supply appears. That’s a problem for offspring survival.
Climate change also affects trees and shrubs. Measurements taken from three lilac species, Syringa chinensis, S. vulgaris, and S. oblata, across the northern hemisphere clearly demonstrate, at bottom left, that the date that the first leaf appears on the shrub moves up by a little more than one day each decade. Where these shrubs grow, the last spring freeze date moves up even faster, about a day and a half per decade.[39] Yet another climate change study, at bottom right, shows that the flowering dates of several tree species in Europe, along with a flowering bulb (the snowdrop), echo the lilac results.[40]
For the climate change skeptic, perhaps all these ecological changes take place because scientists study systems close to growing cities having increasing heat island effects (see Figures 2.7 and 2.7). Perhaps these changes aren’t due to global warming, or rather it’s all due to urban heating. Scientists thought about that idea, as I show next.
———————
[36]Brohan et al. (2006) present the temperature change over the last century. I obtained the data for my plot from www.cru.uea.ac.uk/cru/data/temperature, which provides an excellent discussion of the data’s origins. The data provided monthly deviations (from the 1961–1990 average) for every year, along with the yearly averages; I plotted the yearly average with error bars represented by the lowest and highest monthly deviation.
[37]In Figure 3.7 I show just three examples of species trait shifts arising from a change in average values of climatic variables, but more complicated effects of increased CO2 also occur because of changes in the variation in, say, temperature (Seneviratne et al. 2006). Consider, for example, that when flowers open earlier a person might first suppose that there could be more abundant crops given a longer growing season, but these early-opening flowers might be more susceptible to late spring freezes, resulting in more crop failures.
[38]Dunn andWinkler (1999) examine the effects of global warming on the tree swallow laying date.
[39]Schwartz et al. (2006) studied the leaf dates in lilacs and the last freeze dates in the northern hemisphere. In this study the last spring freeze date is defined as the last date with −2.2C.
[40]Roetzer et al. (2000) demonstrate advancing flowering times in European plants.
