3. 4 Energy & Economy
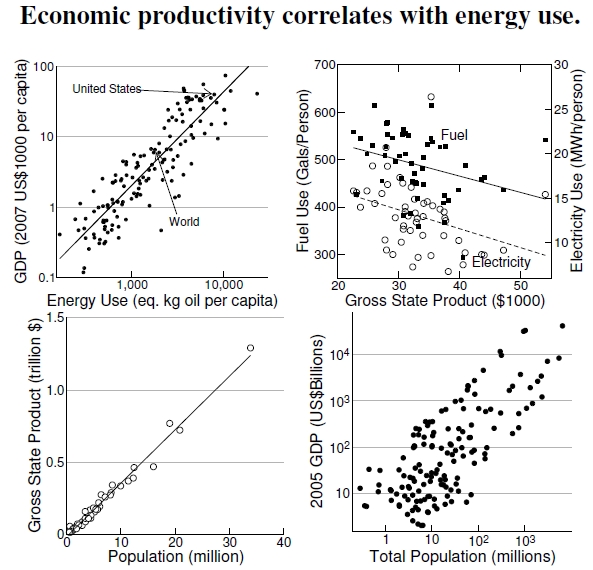
Figure 3.4: At top left, 2004 per capita gross domestic product (GDP) increased with per capita energy use (in oil equivalents) for 144 countries and other entities (data from the World Bank). Within the United States, however, the top right graph shows per capita energy use decreases with per capita gross state product (GSP) (data from the Annual Energy Review 2008). Does energy drive GDP, or does GDP drive energy use, or neither? A near-perfect correlation between GSP and state population size, at bottom left, dictates the striking comparison with Figure 3.3. Globally, population size determines GDP in a much less reliable manner, as seen at bottom right.
We often hear the phrase “energy versus the economy” when people discuss energy-reducing strategies, implying that reducing energy use directly reduces economic activity. Perhaps an argument for reducing our energy use means an argument for reducing our economic activity, thereby reducing our “quality of life.” In case the argument for urban trees involves energy reduction, I look briefly at the association between energy and the economy. The top left plot of Figure 3.4 shows per capita energy use and gross domestic product for 144 entities — mostly countries — and the world average in 2004, using data provided by the World Bank.[20] Gross domestic product (GDP) means the total value of goods produced and services provided by property and people located within an entity.[21] According to this World Bank data, the 2004 world average annual per capita energy use is the equivalent of just over 1,790 kg of oil per year, and the average per capita GDP is $US6,500. Assuming 120 kg per barrel of oil and multiplying this energy use by 6.6 billion people gives about 100 billion barrels, or about 270 million barrels per day. Iceland has the highest per capita energy use, the rightmost point, and Luxemborg has the highest per capita GDP, the uppermost point.[22] This plot supports the broader point that more robust economies use more energy. Or is it that using more energy yields a more robust economy? If the latter, scaling back energy use seems to imply scaling back the economy.
Do I believe the energy numbers? These data state the U.S. per capita energy use as roughly 8,000 kg per year, measured in oil equivalents. Assuming 120 kg per barrel of oil, and that a 42 gallon barrel of oil yields about 10 gallons of gasoline, means that 8,000 kg of oil gives about 2,000 kg of gasoline. At 2.8 kg per gallon, that equals 700 gallons of gas (or about 2 gallons per day). This number agrees roughly with the 450 gallons per person we’ve already seen in Figure 3.2, so, yes, I believe the numbers.
Does the same correlation hold within the United States? Nope. At top right I plot the 2005 per capita gross state product[23] (GSP) against the state-averaged per capita energy use numbers from Figure 3.2. Gross state product, like GDP, marks the value of goods and services produced within a U.S. state. Across these states, the saying should be “energy or economy,” even though across countries the saying seems to be “energy and economy.” However, the bottom left plot shows that this between-state comparison simply reflects the very strong correlation between a state’s GSP and its population, and the bottom right plot demonstrates the similar connection between the country-level quantities.[24]
Future economic productivity increasingly confronts the concerns of energy sustainability and global environmental issues, which come together through the solar power that drives plant growth. We cover that topic next.
————————————-
20World Bank data were downloaded December 3, 2007, and differed drastically from data I downloaded on an earlier date. I do not understand the discrepancy, though the earlier data seemed to have grossly incorrect numbers. Energy use data plotted here were identified by their variable, EG.USE.PCAP.KG.OE, and I obtained the per capita GDP by dividing their GDP for each country, NY.GDP.MKTP.CD, by their population for each country, SP.POP.TOTL. A later visit to the site showed a seemingly new interface without these variables identified as such. My documentation may be outdated.
21“Purchasing power parity” is a more recent international comparison, describing economies from the ability of people to purchase goods. Much more information is available using GDP and GNP; thus I’ve used those measures throughout the book.
22The fit for the GDP–energy plot in Figure 3.4 is significant with R2 = 0.77, fitting the functional form, y = A xB, and gives A = 0.21 and B = 1.33.
23Gross state product data available from the Bureau of Economic Analysis at www.bea.gov/newsreleases/regional/gdp state/2005/gsp0605.htm.
24The correlation between a state’s GSP and its population in Figure 3.4 seems too strong. I don’t doubt that the state-level energy–economy connection likely arises from both quantities co-depending on population size and density, but the nearly perfect correlation makes me wonder whether GSP estimates come from combining state-level population sizes with per capita averages for various industries.
