3. 8 Urbanized Species
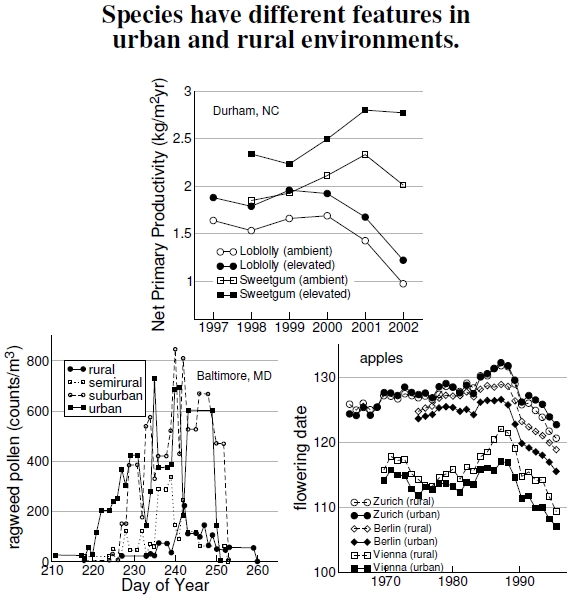
Figure 3.8: At top, net primary productivity increases, at least in the short term, for Durham, North Carolina, loblolly and sweetgum forests grown with carbon dioxide elevated above ambient concentrations (after DeLucia et al. 2005). In the bottom left plot, data taken near Baltimore, Maryland, show that the production of ragweed pollen, a common allergen, increases with greater urbanization (after Ziska et al. 2003). The bottom right graph shows flowering times of apple trees across central Europe; for the most part, urban areas have earlier flowering dates than so-called rural areas (after Roetzer et al. 2000). Temperature differences between rural and urban environments might mimic the changes due to global warming.
High levels of CO2 affect plant physiology. Enhanced CO2 levels increase net primary production (NPP) in both loblolly- and sweetgum-dominated forests (two southeastern trees), as the top plot of Figure 3.8 shows.[41] In these studies elevated treatments increased CO2 by 200 parts per million by volume (ppmV). Dry matter sequestered by these forests increased by 14-26% in loblolly pine forests and 16-38% in sweetgum forests. These sequestration numbers refer to increased biomass, of which about half is carbon. For example, compare the maximum plant growth values of 1 kgC/m2/year in Figure 1.2. Young trees, like these measured here in early successional forests, also grow very fast, which means higher productivity.
Unfortunately, tree growth won’t solve our global warming problems. Earlier I showed how NPP also increased with water (Figure 1.2) and nitrogen (Figure 1.6). All of these results correlate with one another; for example, greater NPP through greater nitrogen availability demands more water.[42] We ought not expect trees to grow twice as fast and twice as big just because we doubled carbon in the atmosphere. Trees need other things to grow, too. People can expect at best only short-term NPP increases with increased CO2 because other features, like nitrogen supply, become the limiting resources for plant growth.[43]
Indeed, the urban heat island poses an interesting scientific opportunity: predicting what might happen with global climate change by observing what happens with local climate change. Right between urban and rural areas, with remnant patches of local ecosystems, the urban heat island might mimic the heating of human-induced climate change. What happens there now might reflect what happens globally in our future, warmer world. At bottom left, the plot compares ragweed pollen production in urban Baltimore, Maryland, with increasingly rural settings. Urban and suburban environments yielded much more ragweed pollen. Local warming also reflects dire global warming scenarios: Urban Baltimore CO2 levels are 30% greater, and its temperatures are about 3.5F higher.[44] Apparently, we can look forward to more ragweed pollen in a warmer urbanized world.
Figure 3.7 demonstrated advancing flowering times in Europe, presumably due to global warming. The bottom right graph shows advancing flowering times for apple trees, one of four species showing similar results, in rural and urban settings. Most of the urban stations show flowering earlier than their paired rural station, except for the Zurich case in which the rural station sits close to an urban area.[45] In addition to earlier flowering, results indicate there may be other, more negative, consequences, for example, mismatches in flowering and pollinator availability, and outright flowering failure.[46] Clearly, changes in both global and local climates affect species other than people, in both urban and rural areas.[47]
——————————
[41]DeLucia et al. (2005) examined the effect of enhanced CO2 levels on the biomass produced by trees. I sometimes refer to NPP by a simpler term, plant growth, but I mean the same thing. One caution is that there’s a difference between how much carbon a plant pulls out of the air and how much change there is in its total mass. Roughly speaking, twice a plant pulls out its NPP from the atmosphere, but respires an amount equal to its NPP, for a net change of its NPP.
[42]Hofmockel and Schlesinger (2007) discuss nitrogen availability to trees under scenarios with enhanced CO2.
[43]Limitation is an ecological concept: If a rate or density changes when a factor is changed, then that factor can be called “limiting.”
[44]In their pollen studies, Ziska et al. (2003) report increased CO2 levels and temperatures around urban Baltimore, Maryland.
[45]Roetzer et al. (2000) demonstrate advanced flowering times in urban plants.
[46]Neil and Wu (2006) discuss some negative consequences of flowering problems with global warming.
[47]Three examples of changed animal behaviors in urban settings come from Melbourne, Australia. One example shows that the urban climate resulted in a bat, the gray-headed flying fox, establishing new winter camps far outside its usual climatic areas (Parris and Hazell 2005), and two examples demonstrate how urban traffic noise changed the vocalization frequencies of frogs (Parris et al. 2009) and birds (Parris and Schneider 2008).
