A.3 Importance & Significance
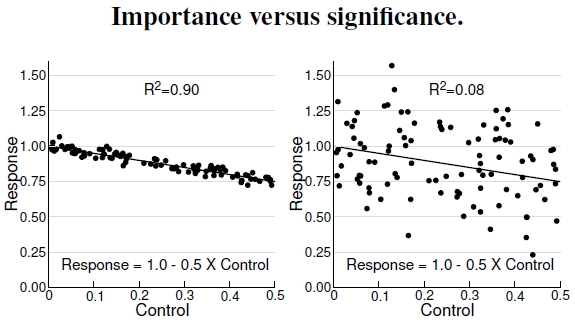
Figure A.3: These two graphs distinguish the difference between a significant correlation and an important correlation. Both graphs show significant correlations between control and response, but the plot at left has a really important (meaning strong) correlation, while the one at right does not. The statistical quantity, R2, measures importance, translating roughly to the fraction that the control parameter contributes to determining values of the response variable. Thus, R2 = 0.9 and R2 = 0.08 mean that control parameter variation “predicts” response values, in the left and right plots respectively, with 90% and 8% strength.
These graphs reveal the meaning of an “important” correlation. Though I don’t show specifics of the statistical measure called “R2” — details can be found in any basic statistics texts or website — both graphs have a significant correlation between the control parameter and the response variable.[2] I know this correlation exists because I made up the data with a computer program[3] based on the displayed formula, precisely with the intent of describing statistical importance. I know, beyond any doubt, that a significant correlation exists between the two variables. Linear regression, the procedure determining the best-fit straight line to control–response data like these, would produce an expression very close to that mathematical equation (within statistical bounds). Whether or not a regression, or statistical connection, demonstrates “significance”, or exists beyond reasonable doubt, comes from statistical considerations I won’t cover here. That said, many tests of significance state a value for the variable p, and p<0.05 typically denotes a significant effect.[4] Essentially, that value means that the observed connection would happen by chance just once out of twenty times (0.05 = 1/20).
At left I show a plot that has a really important correlation between the control parameter and the response variable. A statistical quantity, R2, measures importance, and in this case, R2 = 0.9 means that control parameter variation “determines” ninety percent of response variable variation. In other words, if you know the control parameter value, you have 90% of the information needed to predict the response value. If a correlation with this strength popped up in, say, some type of health problem and an environmental variable, you can bet that scientists (not to mention medical doctors and public policy folks) would sit up and take notice.
However, in the plot at right, with the same linear dependence between control and response features, the response variable has a tremendously greater amount of variation completely unrelated to the control parameter’s value. For example, near a control value of 0.15, the response variable ranges between extreme values of 0.4 and 1.5. In this case, the correlation remains significant, but its importance measure drops to just R2 = 0.08, meaning control parameter variation predicts only 8% of the response variable’s variation. The “control” just isn’t as important to the response, leaving 92% of the response variable’s variation unpredictable. A lot more information of things I know not what are needed to predict the response.
As a real comparison of importance versus significance, compare Figures 4.13 and 5.10.
—————————-
2Statisticians recognize a difference between R2 and r2, one involving situations with a single variable and the other with multiple variables. I make no such distinction.
3Shameless self-promotional material: Learn all about C-programming applied to ecological and evolutionary problems in Wilson (2000).
4Vociferous arguments abound regarding the utility and misinterpretations of the p-value. I won’t go into those arguments, but look at it’s measure of significance as a statistical guide, not a hard-and-fast rule.
