1.10 Harmed Aquatic Life
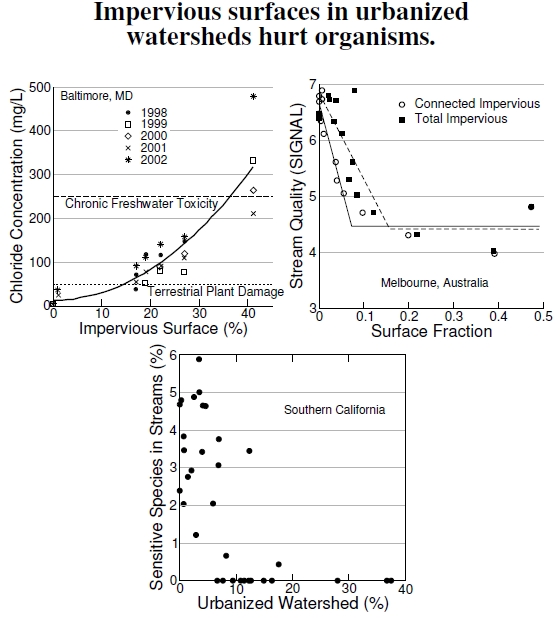
 Figure 1.10: The top left plot shows stream toxicity increasing with impervious surface fraction. In comparison to rural streams, suburban and urban streams have chloride concentrations ranging from 200 to 500 mg/L (after Kaushal et al. 2005). At top right, surveys of aquatic insects measure the ecological health of streams in Melbourne, Australia, with the result that stream health seriously degrades with just 10-20% impervious surface fractions (after Walsh et al. 2005b). Impervious surfaces with drainage directly connected to streams, having the least filtration opportunities, harms aquatic life the most. Streams in Southern California show that as little as 8% watershed urbanization causes the loss of sensitive aquatic insects (after Riley et al. 2005).
The examples presented in Figure 1.10 put streamwater quality into a broader context of ecological health. First, at top left, salt concentrations in Baltimore area streams increase with a watershed’s impermeable surface fraction. Essentially, more parking lots means worse water. These concentrations exceed the toxicity levels defined by Environment Canada and the U.S. Environmental Protection Agency (EPA) for healthy streams, and far exceed levels tolerated by terrestrial plants, implying bad things for streamside vegetation. Other results I haven’t shown for these streams indicate salt concentrations ranging upwards of 5000 mg/L (5 grams per liter), or about one teaspoon of salt in one quart of water.[45] Freshwater streams become toxic to aquatic animals when watersheds have about 35% of their area covered by impervious surfaces.[46]
Another example of poor stream health comes from an urban area of Melbourne, Australia. The top right graph shows how a measure of stream health depends on important measures of impervious surface. Ecologists monitor water quality and stream health by tallying all of the macroinvertebrates in a stream. They then merge these surveys with species-level scores: A stream scores a 1 for each animal of the few species that can almost survive in a toxic waste dump (the equivalent of aquatic cockroaches) and a 10 for each animal that dies from the slightest whiff of a pollutant. The resulting SIGNAL score indicates the stream’s health, with a higher score meaning higher water quality.
The Australian study quantified impervious surface using two different measures. The first type measures total impervious surface covering land in a drainage basin, regardless of where rainwater goes after falling, be it a lawn, ditch, or stormwater drain. The second type, effective or connected impervious surface, is more difficult to measure but also more relevant to water quality because it harms streams the most. This impervious surface fraction drains directly into the stormwater system, and thus directly into streams. With these connected surfaces, stormwater doesn’t touch terrestrial soils at all, implying very little chance if any to filter out any impurities. For example, a Durham road’s storm drain captures rain that falls and washes particulates and trash and oil from the road, flushing it right into Raleigh’s drinking water reservoir.[47] Certainly, some filtration takes place in the streambed, but often the drainage takes place under high rainfall and high streamflow, minimizing even this small opportunity.[48] Even very low amounts of effective impervious surface seriously degraded the Australian streams — when it covers a little less than just 10% of the watershed’s area. This amount translates to around 15% for total impervious surface.
Similarly, an extensive survey of streams in Southern California demonstrated an extensive physical transformation of streams classified as urban, those above 8% urbanized watershed, and resulted in the loss of sensitive aquatic insects as shown in the bottom graph.[49]
————-
[45]Put a teaspoon of salt in a quart of water, and give it a taste; it’s about one-quarter the saltiness of seawater. Now pretend you’re a sensitive insect nymph living in it.
[46]Consequences of high salt concentrations from road applications are discussed by Kaushal et al. (2005).
[47]A large argument has ensued in the Durham–Raleigh area about which municipality should pay for the drinking water supply cleanup— the polluter or the user.
[48]Walsh and coworkers (2005a,b) provide in-depth coverage of urban stream health.
[49]Riley et al. (2005) demonstrated the rapid loss of sensitive stream species with urbanization, a natural measure of water quality. Sensitive species counted included species from the orders Ephemeroptera (mayflies), Plecoptera (stoneflies), and Trichoptera (caddisflies) that are intolerant to disturbed conditions. These insects have either a nymphal stage (with gradual molting into adult form) or a larval stage (followed by a distinct pre-adult pupal stage) that lives and feeds under water.
While reading the Riley et al. (2005) paper in class, a student noted that the “sensitive species in streams” axis was “square root transformed”. That means, for example, that what reads as “4%” really means “16%”, and what reads as “6%” really means “36%”. Thus, the species loss in urbanized streams is even more dramatic than depicted here.
Will Wilson