1. 3 Evapotranspiration and Biodiversity
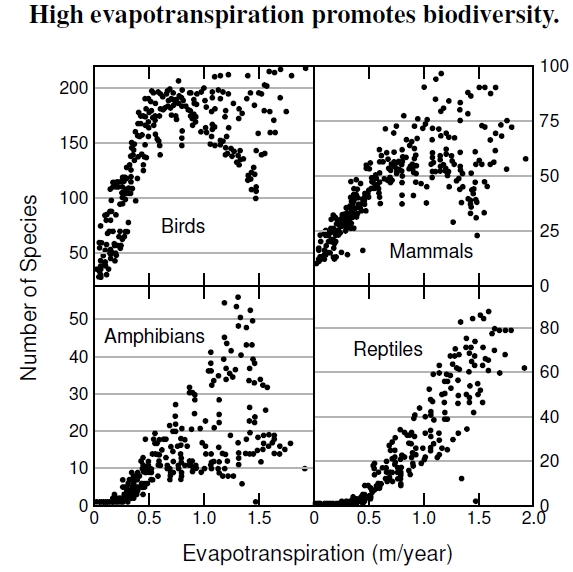
 Figure 1.3: Along with the number of tree species in Figure 1.2, the number of animal species also increases with evapotranspiration. The overall pattern repeats for diverse groupings such as birds, mammals, amphibians, and reptiles across the globe (after Currie 1991). Each point represents a different location, and species counts come from distribution maps found in field guides used by naturalists.
The number of species in a given ecological or evolutionary grouping is called its species richness, and we just saw that tree species richness increases with evapotranspiration. So too does the species richness of birds, mammals, amphibians, and reptiles (Figure 1.3). In other words, add heat, water, and sunlight, and out comes lots of plant growth with lots of species in each general grouping of organisms. As with body size scaling (Figure 1.4), the precise reasons behind these observations aren’t well understood — yet there’s the empirical observation. The data come from compendia of species range maps, perhaps one of the field guides that might be sitting on your bookshelf. An ecologist digitized and overlaid each map, creating a spatial map of species richness for each taxon of organism. Combining that information with independent evapotranspiration data generated these plots.[10] Details differ between the taxa, such as the amount of scatter and saturation or downward trends at very high evaporation, but those details seem unimportant overall. Evapotranspiration clearly drives not only how much plants grow, but also the conditions it promotes, like abundant plant growth, which influences plant and animal biodiversity. According to the study behind these figures, evapotranspiration accounts for more than 90% of the variation in species richness among these organisms! This high value means that in a natural area with minimal human disturbance, all other ecological factors besides evapotranspiration — interesting ecological interactions such as competition, predation, and disease — independently account for less than 10% of the variation behind how many species live there.
Species need evapotranspiration, and evapotranspiration needs water. Water comes from rain, and rain comes from evapotranspiration. Rain enters the ecological loop by soaking into the soil, then being pulled back out by growing plants or evaporation. This key feature has implications for cities. In various places throughout this book, I discuss impervious surfaces such as roofs, roads, buildings, and parking lots. Rainwater can’t percolate into impervious surfaces, interrupting this crucial dependence of plant growth and species richness on evapotranspiration. A hypothetical city, half covered by impervious surfaces, might experience half the evapotranspiration it should because stormwater systems divert rainfall directly to streams, ponds, rivers, lakes, and ultimately oceans (see Figure 1.10). This reduction reduces plant growth, sustains fewer species, and results in fewer benefits from vegetation.
Imagining that humans were just another species, we’ll now compare our population numbers with those of other organisms.
————————————–
[10] The plot showing species richness increasing with evapotranspiration comes from Currie (1991).