1. 4 Lots of People
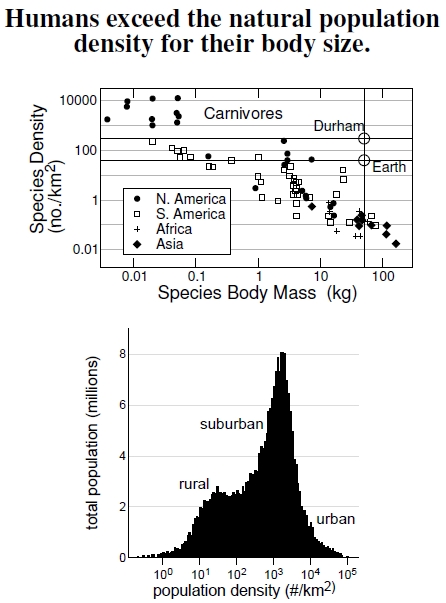
 Figure 1.4: Population densities of mammalian carnivores correlate with each species’ body mass (after Peters 1983; herbivore plots are similar), meaning the larger the body, the lower the population density. In this plot, each data point marks a different species. Assuming a human body mass of 50 kilograms (110 pounds), prehistoric populations span 0.1 to 1.0 people/km². A distribution of 1990 U.S. populations shows that this range matches only the low end of rural densities, and suburban and urban populations exceed it by several orders of magnitude (after Pozzi and Small 2001).
Let’s put today’s human population into perspective. Long before humans became really clever, our population fell in line with the populations of other organisms. That assumption seems reasonable to me, and it provides an estimate for prehistoric population sizes. The plots shown in Figure 1.4 demonstrate the connection between a carnivorous (meat-eating) species’ population density and individual body mass. Mammalian species from different continents fall onto a general trend line, showing that the relation holds across different ecological communities. Species with small individuals have lots of them: many, many mice, but very few elephants. Quite some time ago biologists saw this clear and strong connection between population density and body size, not to mention many other quantities, but still there’s no consensus as to why it should be so. Ecologists call this fascinating research area body size scaling, and many scaling relations exist for other ecological and physiological quantities.[11] Humans, being mammals, were subjected to whatever biological forces impose this body size scaling, and these plots provide rough limits on a prehistoric population size estimate, as well as a stark indication of how far off the line our tremendous recent population increase has pushed us.
To find our place in the top plot, let’s assume a human body mass of a nice, svelte 50 kilograms (kg), which corresponds to a weight of 110 pounds (lb), falls within empirical reason for prehistoric people.[12] Putting this number on these plots provides a rough expectation for our “natural” population density: One person per 10 square kilometers if we were strict carnivores, and one person per square kilometer if we were strict herbivores (from results of a similar curve). We expect, then, that natural human densities ranged between 0.1 to 1.0 people/km² (0.3–3 people/mi²), wherever conditions were suitable for primitive human habitation. Compare these densities to the modern ones across the United States (Figure 1.1), ranging from 0.04 to 27,000 people/km² and shown in the bottom plot of Figure 1.4 for 1990 U.S. populations.[13] Nowadays, rural might be considered anything less than 100 people/km², urban more than 10,000 people/km², with suburban in between. These numbers exceed humanity’s present world-averaged density of 40 people/km², which assumes we spread people out over every patch of Earth.
Multiplying the above natural density estimates by Earth’s land surface, 150 million km², yields the globe’s prehistoric human population, somewhere between 15 and 150 million people. If humans were strict carnivores, the global human population would be about 15 million; if strict herbivores, there would be about 150 million humans.[14] Regardless of diet, these natural estimates fall much lower than Earth’s 6.7 billion people, a number roughly 40 times greater than for herbivores and 400 times greater than for carnivores.[15] In sum, the human population greatly exceeds any sense of a natural carrying capacity.
——————————————-
[11] R.H. Peters wrote one of the best and oldest books, published in 1983, on the topic of body size scaling. I’ve shown the graph for carnivorous animals, but a very similar graph exists for herbivorous animals. I’m not aware of a fully accepted mechanism behind the correlation seen between population density and body size.
[12] Auerbach and Ruff (2004) use over 1,000 fossil skeletons, estimating prehistoric human body size to be about 50–60 kg, which weighs 110–132 pounds.
[13] Pozzi and Small (2001, 2005) describe the details behind the distribution plot of block-level 1990 U.S. populations. They categorized populations as rural (less than 100 people/km²), urban (more than 10,000 people/km²), and suburban in the middle range. I learned of this plot in a 2009 book by the National Research Council, Urban Stormwater Management in the United States.
[14] What about the population sizes for some of the species we have domesticated? The cattle population in the United States over the last few years, 2004 to 2007, has been about 100 million (USDA National Agricultural Statistics Services). There were about 453 million chickens in December 2006, worth about $2.60 each. With reference to these domesticated animals’ population numbers, their life spans, of course, are unnaturally short, meaning that these population numbers are underestimated for their body sizes.
[15] Here’s a different way to look at prehistoric densities. If our world population of 6.7 billion people was a natural density, then we should be a 1-lb (1/2 kg) carnivore (perhaps a large weasel), or a 6-lb (3 kg) herbivore (an average groundhog).