1. 9 Urban Streams

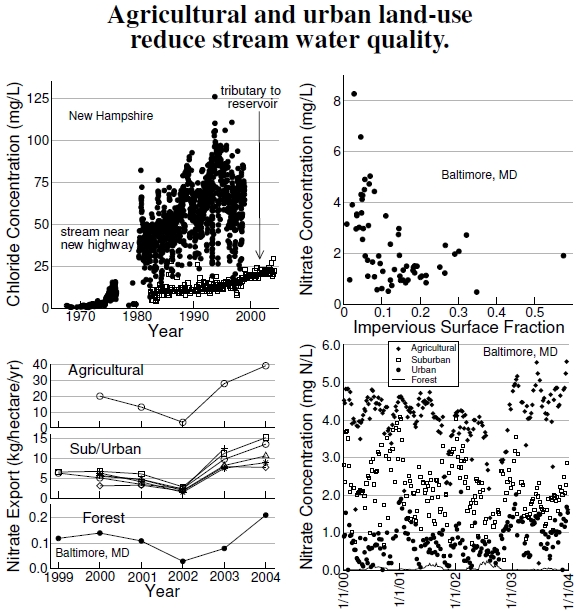
Figure 1.9: At top left, rural stream salinity (chloride concentration) increased after the 1970 interstate highway construction in the Hubbard Brook Valley of New Hampshire’s White Mountains (filled circles), and long-term salinization of a tributary (open squares) to one of Baltimore’s drinking water sources (after Kaushal et al. 2005). At top right, streams near agricultural areas (low impervious surface fractions) around Baltimore, Maryland, have high nitrate concentrations, leveling off in urban areas. These levels reflect nitrate export levels in agricultural and urban areas, shown at bottom left, which far exceed forest levels (after Kaushal et al. 2008). Weekly sampling shows great variability, though clearly indicating levels much higher than forests (after Groffman et al. 2004).
Land-use change also affects streams, rivers, and lakes. When thunderstorms and lightning strike (see Figures 2.4 and 2.6), impervious surfaces bring up the issue of where rain goes when it falls. Results from the northeastern United States demonstrate a couple of problems with stormwater runoff. The top left plot of Figure 1.9 shows chloride (salt) concentrations in two rural streams alongside roads. Open squares depict salt concentrations in a New Hampshire stream flowing into one of Baltimore, Maryland’s drinking water reservoirs.[40] Over a period of 20-some years the concentration nearly doubled. Filled circles (with an inconvenient data gap) show the change in salt concentration of a stream near a highway constructed in the 1970s. Chloride comes primarily from the salt used to de-ice roads and parking lots. Along with the stormwater runoff, salt ends up in streams that empty into reservoirs, lakes, and aquifers. I think of stormwater runoff as parking lot wash-and-rinse water, and in the end, if streams are polluted, downstream reservoirs are also polluted. We drink what we spray on our roads.[41]
The top right and bottom graphs show the connection between nitrogen and land use in the Baltimore area of Maryland.[42] True, agriculture adds nitrogen to streams: Farmers apply roughly 60 kg of nitrogen per hectare per year (recall the importance of nitrogen fertilizers to crop yields in Figure 1.6), but since I depend on food produced in rural areas, and want farmers to survive economically, I’d be rather hypocritical being too upset by their use of nitrogen.[43] On the other hand, suburbanites in these watersheds apply an average of 14.4 kg/hectare/yr to their lawns, which, some might argue, serves no useful purpose. Unfortunately for all of us, not all of this applied fertilizer stays where it should to increase yields and beautify lawns. Some of it runs down ditches and into streams. In the top right plot, high nitrate concentrations in streams occur in areas with lower fractions of impervious surfaces, reflecting runoff from agricultural land. However, the levels remain high for higher impervious surface fractions due to lawn applications.
Nitrogen export differs between land-use types. At bottom left we see that agricultural areas export around 20 kgN/hectare/yr, urban and suburban areas export 5–10 kgN/hectare/yr, while forests export very little. Note the marked export decrease during the 2002 drought: no rain, no runoff. Weekly sampling results, displayed at bottom right, shows the inherent variability in these pollutant levels present in agricultural, suburban, and urban streams.[44] Only forested areas show little variation around essentially no concentration!
————————-
[40]Salt concentrations in streams are discussed by Kaushal et al. (2005). Data for Figure 1.9 were kindly provided by Sujay Kaushal and the Baltimore City Department of Public Works and Hubbard Brook Ecosystem Study groups. The reservoir data involved the Liberty Reservoir, specifically sampling station MDE0026.
[41]Most cities treat stormwater differently than sewage, meaning, for example, that Durham doesn’t treat stormwater at all. (Most municipalities separate these water issues, but not all, and one exception is New York City.) No one can reasonably expect water treatment plants to handle a couple inches of rain over a few square kilometers of impervious surfaces during a two-hour rainfall. The water volumes are immense. However, the first tenth or quarter inch of runoff (called the first flush) has higher pollution levels and warrants special treatment.
[42]Kaushal et al. (2008) provide the nitrogen data around Baltimore, Maryland, for concentrations versus impervious surface fractions and exports from different land-use types.
[43]One can certainly question (as did a reviewer) whether farmers apply more nitrogen than necessary; if so, overapplication leads to more runoff than necessary.
[44]Peter Groffman made available the weekly sampling data allowing me to replot the Groffman et al. (2004) nitrate concentration plot.