1.11 Durham Rainfall
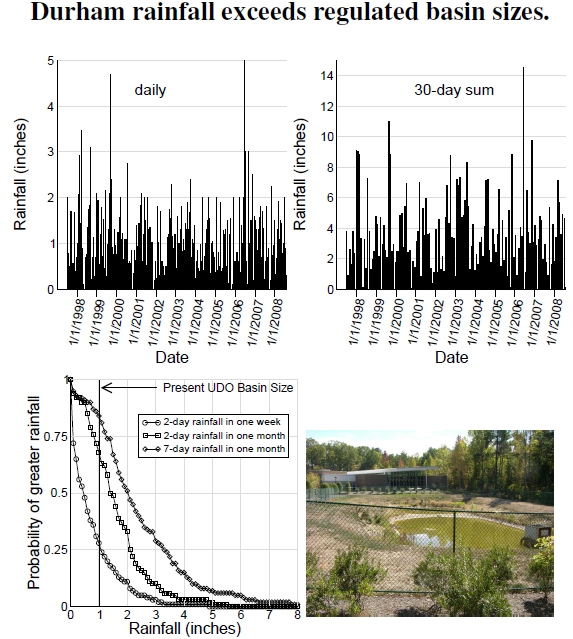
 Figure 1.11: The top left plot shows the nearly 4,000 24-hour rainfall measurements from Durham County, and the top right plot adds up rainfall on 30-day periods throughout the dataset. The bottom left plot summarizes the likelihood of exceeding a given amount of rainfall in any several-day period of time within either a week or a month compared to stormwater regulations. The photo shows a retention basin draining a new North Durham library’s parking lot: if designed more carefully, an opportune location for frog-chasing, pond-stomping educational opportunities.
Rain washes these pollutants into streams. Durham’s yearly rainfall reaches nearly 48 inches, almost 4 inches per month, 1 inch per week, or 1/7 inch per day.[50] Daily rainfall rarely exceeds 4 inches, but often exceeds 1 inch. The top left plot of Figure 1.11 shows the nearly 4,000 24-hour rainfall measurements during this interval from Durham County. The top right plot adds up rainfall on 30-day periods throughout the dataset. Despite the 4-inch average per month, Durham has many months with much less rain, and many months with much, much more rain. It’s during these very wet periods, after Durham’s clay soils have absorbed all the water they can possibly hold, that additional rains run off into urban streams.
Are Durham’s stormwater detention ponds, like that at bottom right, sized properly for Durham’s rainfall? The bottom left plot summarizes the likelihood of exceeding a given amount of rainfall in any several-day period of time within either a week or a month.[51] For example, the curve marked by diamonds shows that with 50% chance, rainfall will exceed 2 inches in a 7-day period, and with 25% chance, rainfall will exceed 3.3 inches. During any given week, with 25% chance there will be a 2-day rainfall exceeding 1 inch.
If basins serve to prevent runoff from immediately entering streams, then development rules and ordinances should reflect Durham’s risk tolerance for runoff that makes its way downstream to the city’s (or other cities’) drinking water reservoirs. In other words, supposing a design that removes water only between rainy bouts, Durham’s development rule’s 3,600 ft3/acre basin size roughly represents a 1-inch rainfall, a volume exceeded roughly 25% of the time by 2-day rainfalls in any week, and about 84% of the time by 7-day rainfalls during any given month. In contrast, a 7,250 ft3/acre basin requirement (which holds a 2-inch rainfall) means that, within any week, the basin would be exceeded 10% of the time during a 2-day period, and 50% of the time during a 7-day period in a month. What risk tolerance is appropriate? Should stormwater systems be designed to contain every drop of the 14+ inch rainfall month in 2006, at some unknown cost, or is it sufficient to handle monthly totals of 6 inches?
Citizens must ask similar questions of all types of stormwater systems, including constructed wetlands and infiltration trenches.[52] Whatever option cities choose, trade-offs exist between upfront and maintenance costs, costs borne by developers and costs borne by citizens, and local stormwater costs versus nonlocal downstream pollution and sediment costs (see Figure 1.12).
My photo shows another trade-off: a low-cost, fenced-off, single-purpose retention pond at a public library chosen over a more expensive constructed wetland where trees, birds, frogs, and children may have played.
————————-
[50]I found the 1997–2008 rainfall data from the National Climatic Data Center (ncdc.noaa.gov) for Durham’s NWS COOP Station No. 312515. Data for this station go back to 1899, but only this more recent data was freely available. Note that some dates for the Durham rainfall data lack entries and I assumed zero rainfall as a conservative estimate. Data like these exist for stations located nationwide.
[51]I wrote a simple C computer program using the Durham rainfall data as input, determined the frequencies of rainfall amounts over these different periods, and then output the appropriate integrals over the probability distributions. The program is freely available from my website.
[52]The National Research Council produced an excellent overview of urban stormwater management, including a discussion of mitigation approaches (NRC 2008).
UDO stands for “unified development ordinance”