4.10 Ozone Variation
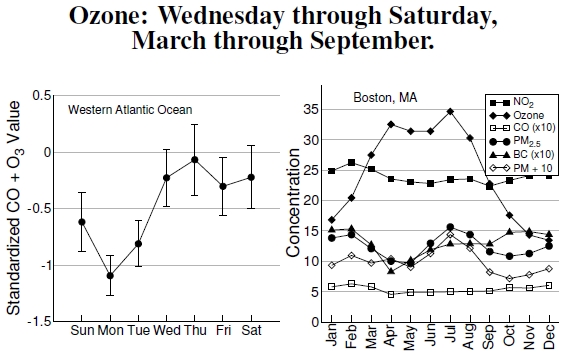
Figure 4.10: The left plot shows combined ozone and carbon monoxide concentrations over the eastern Atlantic Ocean for each day of the week averaged over the years 1991 to 1995 (after Cerveny and Balling 1998). The dip occurs from reduced weekend traffic. The plot on the right shows natural, seasonal variation in several pollutants in Boston, Massachusetts (after Zanobetti and Schwartz 2006). Numbers measure concentrations in units of μg/m3 for black carbon (BC), nontraffic particulate matter (PM) and smaller than 2.5 microns (PM2.5); parts per billion (ppb) for nitrogen dioxide (NO2) and ozone (O3); and parts per million (ppm) for carbon monoxide (CO). Ozone peaks in the summer heat.
If there’s any place that should be only weakly affected by people, it might be way out in the Atlantic Ocean some 180 km off the coast of Nova Scotia, at Sable Island, about the same distance traveled by the power plant plume in Figure 4.8.[53] Unfortunately, both situations show high-ozone levels a couple hundred kilometers downwind from their pollution source. The left-hand plot in Figure 4.10 shows a combined, “standardized” measurement of carbon monoxide (CO) and ozone (O3) at Sable Island, with strong weekly variation. No natural processes take place on a weekly basis: Something about people and their busy Monday through Friday schedule — most likely traffic — produces elevated pollution levels Wednesday through Saturday out in the Atlantic Ocean. Low levels Sunday through Tuesday rebuild from output on Monday and Tuesday, leading to high levels starting on Wednesday. In some ways, this result replicates the Atlanta Summer Olympics results in Figure 4.2 that showed decreased levels of pollutants when inner-city traffic was halted.
Here the composite variable’s actual value doesn’t have much meaning and should have an average of zero, but some data pairs are missing, producing an average negative value. To make comparisons with other plots, the original data set shows ozone levels mostly between 20 and 40 ppb, sometimes ranging up to 80 ppb, and carbon monoxide levels between 80 and 150 ppb, ranging up to 250 ppb.[54] The observed weekly variation, with the only possible explanation being people, is the important part.
The right-hand graph plots the concentrations of various pollutants in Boston, Massachusetts, throughout the year.[55] Some pollutants have an essentially stable level, others have variations of around 50%, but in stark contrast, ozone peaks strongly in the spring and summer months, two to three times higher than in the winter months. Resulting health problems are worse then, too (see the ozone–health study in Figure 6.2).
Two of these pollutants are just small particles of junk, PM2.5 (particulate matter smaller than 2.5 microns — 2.5 × 10⁻⁶ meters or less), and black carbon (also known as carbon black). The pollutant listed as PM (particulate matter), comes from an estimate of nontraffic sources.[56] When you see a bus or diesel engine emitting black smoke under a heavy load, you’re seeing black carbon. Diesel black carbon emissions have a size right around 50 nanometers, or 50 times 10−9 meters, or 1/20th of a micron. For scale, human hair varies from 20 to 200 microns in diameter. A wavelength of visible light is about 500 nanometers, and black carbon looks sooty because it has a size that absorbs and scatters light very well. Very small stuff indeed that can get into the deepest parts of lungs.
—————–
53Pollution levels varying with day of the week comes from Cerveny and Balling (1998).
54Original data for the weekly ozone-CO levels at Sable Island comes from Parrish et al. (1993).
55Pollutants in Boston, Massachusetts were published by Zanobetti and Schwartz (2006).
56Nontraffic particulate matter was measured from the residuals of the PM2.5 measurements regressed against black carbon; hence, negative values can arise.
