4. 6 VOC Variation
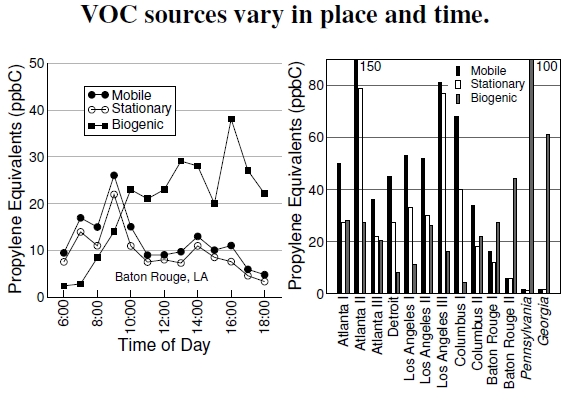
 Figure 4.6: At left, measurements taken on the Louisiana State University campus in Baton Rouge, averaged over July 18–26, 1989, show the changing contributions of the three sources over the course of the day. The plot at right presents the relative reactivity contributions of VOCs from mobile, stationary, and biogenic sources (both plots after Chameides et al. 1992). Data come from samples taken in the 1980s. Pennsylvania and Georgia indicate rural sampling stations.
As a quick review, there are two broad classes of anthropogenic sources of volatile organic compounds—mobile (think vehicles) and stationary (think power plants and industrial centers)—and a multitude of biogenic sources, which include vegetation and microbial activity in soils. These different sources of VOCs change in importance throughout the day, as the left graph in Figure 4.6 shows.[36] All three sources are made relative to a common measure, the reactivity of propene, made necessary due to the high diversity and differences of chemical species of the three sources.
The early morning peak comes from rush-hour traffic[37] (see Figure 4.14), and the subsequent reduction takes place because sunlight breaks apart NO2, as shown in Figure 4.7, which then reacts with the VOCs. We see a similar situation of rapidly depleted emissions in the power plant plume and city, as shown in Figure 4.8.
Understanding the changing importance of these various sources, with one goal being reasonable emissions regulations, requires a comparison between the many chemical species produced by vegetation, like isoprene, C5H8, and the vast array of anthropogenic species, the main ones being ethane, propane, iso-pentane, ethylene, acetylene, toluene, and so on.[38] Reactivity to OH serves as the basis of comparison, as all of these volatile organic compounds, including methane (CH4) and carbon monoxide (CO), react with OH as the starting point for generating ozone and other chemical irritants. In the reactions depicted in Figure 4.7, each molecular species can replace methane along the bottom reaction chain. What we want to understand is how much each chemical contributes to, say, ozone production, taking into account its concentration and its ability to react with OH. Thus, each VOC species gets scaled into an identically reactive amount of propene (also called propylene), which has chemical formula C3H6.
In the right plot we see, quantitatively, the wide variation across the country in VOC source contributions that we observed visually in Figures 4.1 and 4.4. The southeastern United States has much higher biogenic emissions, and the difference in location means a greater amount of VOCs, resulting in a NO-limiting situation. Because of this difference, different things limit ozone production in forests and cities. In forests there may be lots of VOCs, but the relative absence of NOx might limit ozone production. NOx comes from fossil fuels, and siting coal-fired electrical power plants in rural southeastern areas certainly can introduce nitrogen emissions, with tremendous ozone implications. In cities and their surroundings, there’s lots of NOx, but ozone production tends to be limited by VOCs. In other words, ozone-reduction strategies depend on these different limiting situations. Imagine the complexity of creating nationwide emissions guidelines!
—————————————-
[36]VOC sources changing during the day were disussed by Chameides et al. (1992) and Sillman (1999).
[37]Estimates of the two human source contributions reflect one another in Figure 4.6, at least in part because some VOCs were just divided equally between mobile and stationary.
[38]A description of VOCs can be found in Warneke et al. (2007).