4.11 Rural Ozone
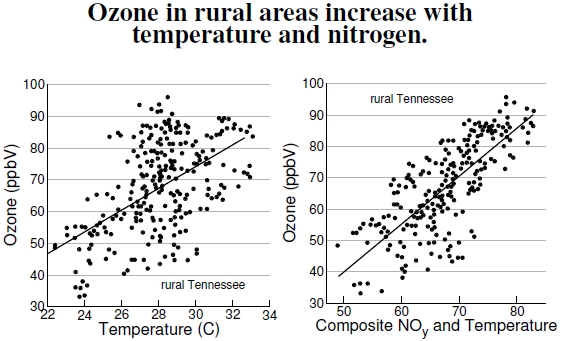
 Figure 4.11: These plots depict ground-level ozone concentrations in rural areas of Tennessee (Giles County), which clearly increase with temperature, as seen in the plot at the left. However, in the other plot, data positioned closer to the regression line show that reactive nitrogen, NOy, also plays a crucial role, as seen in Figure 4.7. The units on both vertical axes are parts per billion by volume (ppbV) (after Olszyna et al. 1997).
Ozone occurs naturally, both high in the stratosphere where it removes high-energy photons that would otherwise damage living tissues, and down near the ground in the troposphere. Data from 1991, in the left plot of Figure 4.11, show variation in ground-level ozone concentrations with temperature in the rural farmland of Giles County, Tennessee, about 75 miles (120 km) south of Nashville, Tennessee. The nearest towns are about 15 km away from the measurement site, a lightly traveled road sits 200 m away, and a two-lane highway 6 km away. Results depend on a number of factors, including cloud coverage, which changes the light available for some chemical reactions (see Figure 4.7), and atmospheric stability or stagnation (which affects mixing rates). VOC emissions from vegetation and soils also influence the data.[57]
Even better than temperature alone, a combined measure of temperature and total reactive nitrogen, NOy (=NO+NO2+HNO3+N2O5…), well predicts ozone concentration, shown at right. Rural areas have three main sources of reactive nitrogen: industry, motor vehicles, and soils. Lightning also produces reactive nitrogen, roughly one-fourth that released by burning fossil fuels, but just one-twentieth of the nitrogen made available by the synthetic Haber–Bosch process.[58] Which source is responsible? Industrial emissions come with sulfur dioxide, SO2, and motor vehicles come with carbon monoxide, CO. Soils do not produce these additional compounds, meaning SO2 and CO can be used to disentangle the various sources. In this study, scientists reported that when SO2 and CO were at their estimated background levels, NOy concentrations were about 2.3 ppbV, roughly double that in Alabama’s nearby forested sites. Agricultural fertilizers explain this difference. Beyond the nitrogen accounted for by agriculture, which amounts to a rough doubling, two-thirds came from industrial sources and one-third from motor vehicles. Thus, rural areas experience agricultural, urban, and industrial pollution.
Chemical reactions generally speed up with temperature, but because temperature affects every reaction leading to ozone, one way or another, no one really knows which of the many reactions involved with ground-level ozone and emissions have the most impact. Throw in an arbitrary number of VOC species, and understanding what takes place becomes a field of detailed study. Ozone levels will likely get worse as global temperatures increase,[59] a fact that we’ll discuss in upcoming plots.
Going into the plots on the next page, take note here of rural ozone levels: roughly 40-90 ppbV.[60] Let’s take a deeper look at urban environments.
——————————-
[57]Ozone levels in rural Tennessee were studied by Olszyna et al. (1997).
[58]Galloway and Cowling (2002) discuss various sources of reactive nitrogen, including estimates for natural and historical anthropogenic sources.
[59]Bernard et al. (2001) results suggest what might happen with the increasing temperatures expected with climate change.
[60]I’ve already shown one example of urban ozone levels from Boston, reported in Figure 4.10: Summer levels reach only about 35 ppb, though the EPA website shows that the Boston area has often exceeded the 90s, violating regulatory standards. I suspect it’s just a matter of averaging levels throughout the day and over several years, but the paper (Zanobetti and Schwartz 2006) makes no mention of how the values, provided by the EPA, were averaged.