4. 8 Space, Time, & Ozone
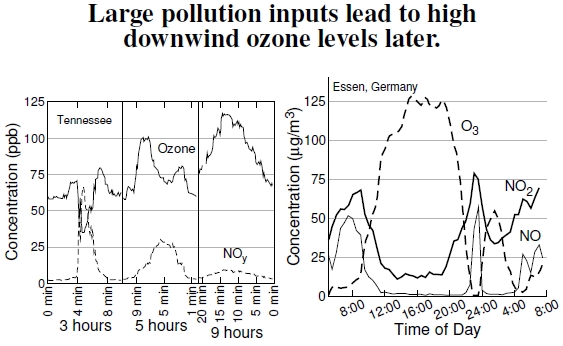
Figure 4.8: Coal-burning power plants cause downwind ozone problems, exemplified here, at left, by emissions upwind of Nashville, Tennessee (data courtesy of Noor Gillani; after Gillani and Wu 2003). Emissions occurred midmorning July 16, 1995, and the curves show ozone and nitrogen concentrations at three approximate later times. Horizontal axes display relative times of measurements from a helicopter traveling about 3-4 km per minute through the plumes. After 9 hours, the plume had drifted about 110 km downwind and expanded to about 50 km wide from its point source emission. (NOy means total reactive nitrogen.) At right, a study from Essen, Germany, shows how morning rush-hour emissions of reactive nitrogen lead to high-ozone levels during a summer day, crashing with afternoon rush-hour and sunset. An urban heat island instability induces an atmospheric turnover, leading to a second ozone peak (after Kuttler and Strassburger 1999).
Nitrogen emissions from coal-fired power plant smokestacks demonstrate how upwind emissions produce downwind ozone problems.[44] The graph at left in Figure 4.8 shows the changes occurring in the plume as it drifts downwind from a power plant, measured by a helicopter making successive passes through the plume.[45]
Immediately after emission, ozone levels within the plume quickly fall because the plume has lots of total reactive nitrogen, NOy, and the NO–O3 reaction in Figure 4.7 removes the ozone, greatly increasing NO2. As the plume ages, several hours later and generally some 50-200 km downwind, the high levels of NO2 become a problem because sunlight splits off an oxygen atom, which interacts with O2 to produce ozone. This plume in Tennessee sweeps over Nashville six or so hours after emission, with ozone levels of about 110 ppb instead of the surrounding 50 ppb levels.
The graph at right, in essence, demonstrates in-place plume development. These results, from Essen, Germany, come about over the course of a day. Morning rush-hour traffic puts a large amount of reactive nitrogen into the city’s air, and with the onset of sunrise, these emissions lead to high levels of ozone several hours later. With afternoon rush-hour traffic, and sundown, this ozone disappears as it reacts with newly emitted nitrogen.[46] An interesting secondary ozone peak erupts, presumably because of an atmospheric turnover induced by heat-islandcaused instability. This turnover replaces the ozone-depleted air with ozone-rich air.
Results like these were important reasons for the Clean Air Act of the 1970s, when smokestack emissions produced even worse air quality problems. Ozone levels declined quite a bit after 1985,[47] with the EPA estimating that NOx and VOCs declined 10 and 14%, respectively, in just the five years between 1996 and 2001 (see Figure 4.2). Air quality today, and in the future, may not be as grim as depicted here, but certainly needs constant monitoring. These emissions changes may, in part, reflect a change in the U.S. economy from one of production to service,[48] though Americans use more electricity and gasoline independent of this economic change. Probably the reduction arises from many factors, but it may be difficult to determine what fraction is due to which factor. In contrast to a rosy picture, some studies predict an increase in ozone problems with the increased temperatures expected with global climate change.[49] For example, at higher air temperatures, reactions might take place faster, with ozone produced closer to emission sources.[50]
————————————
[44]I thank Noor Gillani for providing the original curves of power plant plumes from the Gillani and Wu (2003) report, which I have not seen. A much earlier, but similar, study with regards to the plume study is Gillani et al. (1981). Other interesting plume studies include Ryerson et al. (2001) and Luria et al. (2003).
[45]Although this graph depicts nitrogen levels, some earlier studies measured sulfur dioxide, SO2, as a proxy for NOx levels because it was technically easier. Even though both are major emissions of coal-burning power plants, their chemistries differ, and nitrogen provides the needed information. Connections between SO2 and NOx levels have been examined, to some extent, by Likens et al. (2005).
[46]Kuttler and Strassburger (1999) measured ozone and nitrogen levels in Essen, Germany.
[47]Swartz et al. (2005) discuss ozone levels decreasing since 1985, though, in response, Kinney et al. (2005) point out that ozone levels aren’t all that responsive to decreasing emissions.
[48]Data from the Bureau of Economic Analysis shows that the U.S. economy has a greater emphasis on producing services, not goods, and the shift occurred sometime just before 1970. Industry-specific contributions to GDP were compiled by the Bureau of Economic Analysis and can be found at www.bea.gov/national/nipaweb. Since about 1950, about 20% of GDP shifted from private goods-producing industries to private services-producing industries. However, as I write this book in the fall of 2008, the global financial world seems to have collapsed. Another couple of years might see a drop-off in the contributions by finance and real estate. Think of these economic data as “snapshots.”
[49]Knowlton et al. (2004) predict greater ozone issues with climate change.
[50]Downwind distance changes in ozone production were pointed out by Olszyna et al. (1997).
