4. 5 Heat, Light, & Tree VOCs
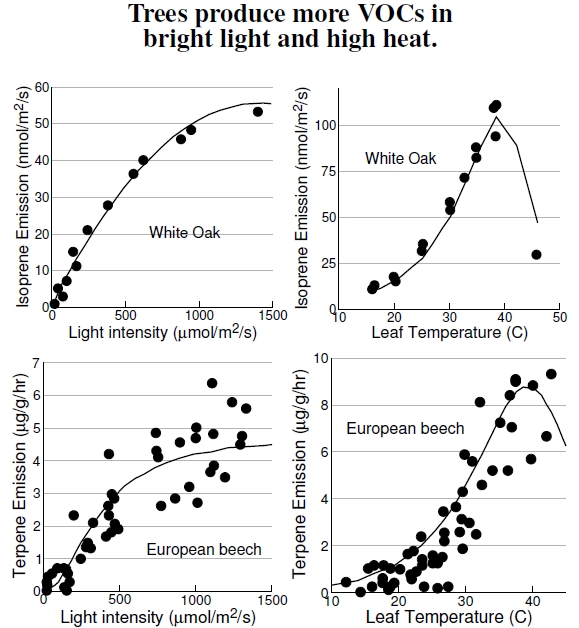
Figure 4.5: The isolated dots for tree emissions in Figure 4.3 hide the large variation actually observed. Here isoprene emissions of white oaks, measured on intact leaves and branches (after Baldocchi et al. 1995), and monoterpene emissions of the European beech (after Dindorf et al. 2006) show great variation as a function of the light level and temperature. Hot and bright summer days yield high emissions, contributing to high VOC concentrations.
The emissions variation shown on the plots in Figure 4.5 underlines the simplistic view of species-level biogenic emissions implied by Figure 4.3’s data points. Most of the measurements reported in Figure 4.3 used individual leaves, and some values resulted from just one or two measurements on a single species of the genus. These emissions estimates are difficult measurements, and many complicating features and realistic environmental conditions must be sacrificed: You just can’t stick a whole tree into a plastic bag to measure its emissions. Because of these difficulties, little information exists on how these emissions change under environmental stresses like drought or polluted environmental conditions.
Using just two factors important to urban environments, light[31] and heat, these plots show how VOC emissions by beech and oak trees vary with environmental conditions.[32] The left-hand plots show that isoprene emissions saturate at high sunlight, presumably when plants need thermal protection more than ever. Emissions also depend on details like leaf age — young leaves have lower emissions — while other factors, like humidity, are less important.
One might conclude that these emissions curves mean that tree physiology changes with urban heating or global warming. When scientists speak of uncertainties about climate changes taking place alongside global warming, and say they really don’t understand all of the implications, this is the kind of detail and uncertainty being discussed. How will changes in tree physiology feed back into climate change? These are hard questions, but no one should dismiss global warming because scientists don’t understand details like these.
The white oak data at the top comes from measurements on individual leaves, with emissions measured with respect to leaf area, not leaf mass, making the comparison with Figure 4.3 difficult.[33] The beech data arise from measurements of a sunlit branch at the top of a 160-year-old tree, incorporating some self-shading, where one leaf shades another.[34] Figure 4.3 represents terpene emissions for beech as about 0.5 μgC/g/hr, but here the value ranges from 0 to 10 μg/g/hr,[35] showing the roughness of these average values. So, yes, trees “pollute,” and some pollute more than others, but it’s hardly appropriate to compare emissions from organisms with fossil-fuel emissions from the machines humans use.
——————————–
[31]Light intensity in these plots includes only the photosynthetically active radiation (PAR) in the spectrum, usually that within the visible range 400 to 700 nanometers. Units on these scales are μmol/m2/s, of which only the μmol needs explanation. Recall from chemistry class, Avogadro’s number being 6.02 × 10²³, the definition of the number of atoms or molecules in one mole. One can count photons the same way, but the relevant intensity for PAR sunlight is 1,000 μmol/m2/s, meaning every second about 600,000 quadrillion photons strike a meter-squared area.
[32]White oak emissions data come from two papers of one collaboration. One paper, Baldocchi et al. (1995), reports data from a meeting presentation published later in Harley et al. (1997) with much greater detailed analyses.
[33]Harley et al. (1997) show values for white oak in the range of those shown for beech.
[34]The data are certainly real, but some of the curve-fitting, that I’ve reproduced here, might be taken with some hesitancy; there’s very little data to support the drop-offs at high temperature, even though it’s clear that such a drop must happen simply because trees must shut down at too high of a temperature.
[35]Terpenes are mostly carbon by mass, so the slight difference in units, μgC/g/hr versus μg/g/hr, represents just a factor of 0.88 converting emissions per gram from milligrams isoprene to milligrams carbon.
