6. 6 Air Conditioning
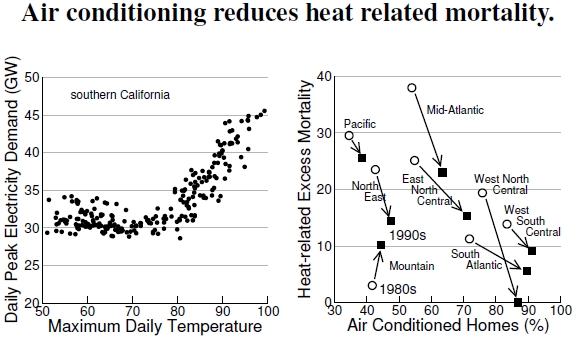
 Figure 6.6: The left plot shows the amount of electricity supplied by Southern California Edison in 2004 versus the maximum daily temperature, with every day being a separate data point (data provided by Guido Franco, after Franco and Sanstad 2006). Electricity use increases when air conditioners turn on at high temperatures. At right, air conditioning reduced heat-related mortality (after Davis et al. 2003). Open circles indicate values from the 1980s, and the filled squares denote values from the 1990s. Most areas reduced heat-related mortality with increased air conditioning.
Let’s put our energy use into the context of just one of the reasons for using it: Air conditioning relieves heat discomfort and improves health. We see the signal of AC use in California’s peak electricity use, in the left-hand plot of Figure 6.6, increasing sharply as the temperature rises. As this California data shows, millions of air conditioners kick in on days when peak temperatures hit 80F. Here, the graph plots each day’s peak electricity use against each day’s peak temperature for every day from June to September 2004.[24] Electricity demand increases by about 3% for each degree Celsius above 27C, or 80F. An increase in air conditioning demands more electrical power plants, more energy use, and all the associated local and global environmental problems.
Urban environments enhance the need for air conditioning: Greater urbanization increases the heat island effect and requires more electrically supplied air conditioning. Cooling the additional 0.5-3C temperature increase due to the urban heat island (UHI) effect uses an estimated 5 to 10% of urban energy. That cost reflects real money: UHI-associated cooling costs run about $2-4 billion per year over the United States.[25]
We cool our air not just because it provides comfort. The right-hand graph shows that our heat-related mortality decreased as more homes became air conditioned between the 1980s and 1990s.[26] This mortality reduction ignores the consequences of possible emissions from electricity production specifically for air conditioning. Certainly we use more air conditioning in the hottest times of the year, and, as we’ve seen in Figure 4.8, emissions from this increased use travel downwind and generate ozone, leading to greater health problems.
Should we reduce our energy use by reducing air conditioning, while accepting more asthma emergencies and heat-related deaths? Air conditioning cost estimates for the United States in 1999 were $36 billion per year, or about $100 per person per year.[27] Greater use of energy conservation strategies would reduce our need for air conditioning while simultaneously maintaining the health benefits, for example using thermal mass to minimize peak temperatures, as described in Chapter 2. Of course, these short-term estimated expenses ignore hard-to-calculate long-term costs of greenhouse gas emissions from fossil fuel use.
Finally, results shown here involve the standardized, age-adjusted mortality discussed in Figure 6.7, a standardization that seemingly magnified a mortality reduction trend compared with gross statistics. Whether or not that magnification is real, the air conditioning-mortality results shown here removed that trend before calculating heat-related excess mortality.
————————————
[24]Electricity use data with temperature in Figure 6.6 was provided by Guido Franco, discussed in Franco and Sanstad (2006). The data come from CalISO, the electric company that serves much of California.
[25]Akbari et al. (2001) estimated the energy use due to the UHI effect.
[26]Davis et al. (2003) show heat-related mortality reductions through air conditioning use.
[27]Pomerantz et al. (1999) estimated U.S. air conditioning costs.