6. 9 Milwaukee: Income & Trees
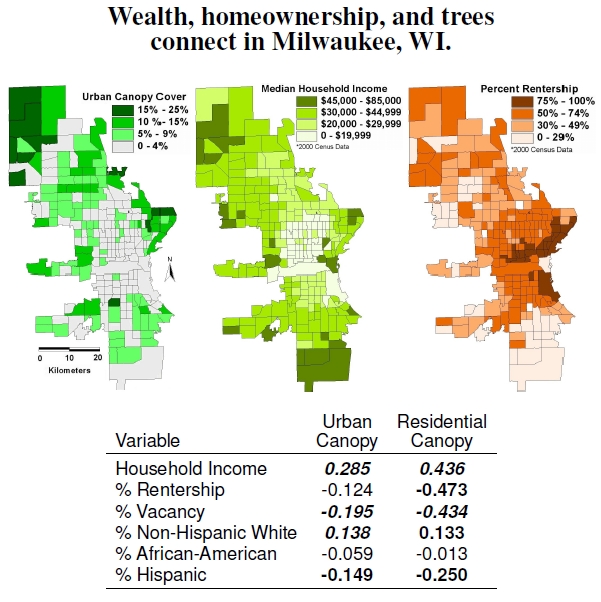
Figure 6.9: Maps showing urban canopy cover, median household income, and percent rentership in Milwaukee, Wisconsin (courtesy of N. Heynen, after Heynen et al. 2006). Bold numbers indicate significant correlations (p < 0.05), with italics even more (p < 0.01). Urban canopy averages tree coverage over census blocks encompassing broad land-use types, whereas residential canopy only includes places where people live.
As I mentioned earlier, Durham’s not the only place where trees follow wealth. Over the next few pages, I show that clear inequities exist within cities among various socioeconomic categories, the amount of urban forests and vegetation, and healthy environmental conditions. The three maps in Figure 6.9 show the urban canopy coverage, median income, and rentership levels across Milwaukee, Wisconsin. Household income provides a strong positive correlation to both urban canopy (citywide tree coverage) and residential canopy (specific to residential land use), while rentership level correlates just as strongly, but negatively, to residential canopy cover. For example, the central portion has high rentership, low canopy, and low income. I doubt that the correlation arises because low-income citizens chop down residential trees to heat their homes, or that money grows on trees, providing the income that supports good education. Also note exceptions to the correlation, such as high rentership areas with high income and low canopy cover: These are signs of a trendier urban lifestyle.
Milwaukee has a total urban canopy cover of about 7.1%, and the city of Milwaukee manages only 4.3% of city’s urban canopy cover.[33] Milwaukee’s urban forester once stated that about 99% of the city lands that could have trees already have trees.[34] In other words, more than 95% of Milwaukee’s urban canopy extends beyond the city’s responsibility. In contrast, private residential property, holds 27.8% of the tree canopy, and another 27.1% sits on commercial and industrial property. Public schools, libraries, and such have 12.7% of the canopy cover, and parks, presumably with minimally managed trees, make up about 28.1%.
These numbers indicate that increasing urban canopy has to be promoted on residential rental and commercial property, which means programs designed to enhance the property of profit-motivated landowners, who, in fact, might not associate “increased vegetation” with “enhanced property.”[35] Something as simple as a free tree program designed to regreen a city, as bizarre as it sounds, adds to the inequity problem. In one example from Milwaukee, Wisconsin, homeowners represented 89% of the people participating in the giveaway, yet that group makes up only 45% of the citizens.
In low-income areas of Milwaukee, trees mostly grow along fencelines and very near house foundations; in these situations trees are seen as nuisances that break foundations and fences as they grow too large. Removal of these trees exceeds intentional planting by others in the same urban areas.
————————————
[33]Heynen et al. (2006) examine canopy cover in Milwaukee, Wisconsin.
[34]Milwaukee’s forestry department manager statement as expressed in a footnote of Heynen et al. (2006).
[35]Perkins et al. (2004) discuss the inherent inequity in canopy cover resulting from tree-planting programs that focus on owner-occupied dwellings in the face of canopy deficits in high-rentership areas of Milwaukee.

[...] (Landry & Chakraborty, 2009). Climate studies done by Dr. Will Wilson of Duke University in “Constructed Climates: A Primer on Urban Environments,” also suggest the same correlations between tree canopy coverage and wealth, housing tenure, and [...]