6. 1 Heat Wave Deaths
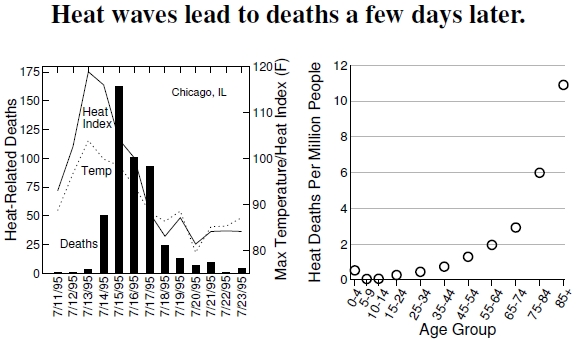
 Figure 6.1: A heat wave swept Chicago, Illinois, during July 11-23, 1995, leading to at least 700 heat-related deaths (left plot). I plot both the temperature and the heat index, a measure of “effective temperature” that accounts for reduced perspiration effectiveness because of high humidity. The peak of heat-related deaths occurs several days after the heat wave (after McGeehin and Mirabelli 2001). A study by the Centers for Disease Control shows, at right, that our elderly population risks the greatest heat-related mortality (after CDC 1995). Underlying these mortality rates were 5,379 deaths attributed to heat between 1979 and 1992. The CDC data indicate, for example, around 10 deaths per million 80-year-old people, against a background mortality of roughly 70,000 deaths per million 80-year-old people (see Figure 6.7).
Most heat-related deaths occur from heatstroke, defined by a body temperature exceeding 105F (40.6C), compared to normal body temperature of 98.6F (37C). Variability causes the problems, rather than heat itself (see Figure 6.5), with duration, overnight heat, and non-air-conditioned automobiles and dwellings appearing critical (see Figure 6.6).[1] Heat affects urban dwellers most — because of the urban heat island — and in particular, the young, elderly, poor, and people on certain medications. Even factors like living on the top floor of an apartment without air conditioning affects one’s risk. Clearly important strategies that reduce this heat-related risk include drinking liquids and having air conditioning, connecting the availability of coping strategies to socioeconomic status.
A nasty heat wave that went through Chicago, Illinois, in 1995 clearly demonstrates heat-related mortality and how that mortality takes place a few days after the heat wave’s passing. During just a few days, July 11-23, there were 85% more deaths, and hospitalizations increased by 11% compared to the same period the previous year. In total, more than 700 additional deaths took place because of heat. I have not seen any clear mechanism spelled out explaining the time lag between heat and mortality, but it may not be that big of a puzzle: Perhaps people think they can manage the heat, and do so for a while, but then collapse from stress and dehydration.[2]
The heat index combines temperature and humidity, generally increasing with both variables, and better represents the body’s cooling ability through perspiration. The U.S. National Oceanic & Atmospheric Administration (NOAA) has a chart showing dangerous heat index values: Any temperature above 100F and 40% humidity is either dangerous or extremely so, and a humidity of 100% is dangerous for temperatures above 90F. A mathematically complicated and slightly curved line joins these two points, but a simpler straight line doesn’t do too bad a job. The heat index’s dangerous limit for humidity R (measured as percent) depends on temperature T (in Fahrenheit) as R = 100 − 6(T − 90).[3] During the summers in Durham, I certainly can attest to this line being roughly correct.
The Centers for Disease Control (CDC) analyzed more than 5,000 deaths between 1979 and 1992 that were listed as heat-related on their death certificate (excluding listings identified by conditions aggravated by heat, but not explicitly stating heat). By their estimate, between 148 and 1,700 heat-related deaths occur each year, with Alabama, Arkansas, Arizona, Georgia, Kansas, Mississippi, Missouri, Oklahoma, and South Carolina listed as the states with the greatest mortality risk.[4] The CDC analysis demonstrates that increasing age presents the greatest risk factor associated with heat-related death, though relative to other children, children less than 4 years old also have a higher risk.
——————————-
[1]McGeehin and Mirabelli (2001) discuss many aspects of heatstroke and heat-related mortality, including the feature that mortality takes place a few days after a heat event.
[2]Regarding the time delay between peak heat and peak deaths, I quote one case report from the Centers for Disease Control (CDC 1995): “On June 13, 1994, in Houston, Texas, a 29-year-old mentally impaired women was found lying on the floor of her garage. She was unresponsive when admitted to a local hospital and had a rectal temperature of 107.9F (41.9C). She died within 2 days of arrival at the hospital. The outdoor temperature and humidity had reached 92.0F (33.3C) and 91%, respectively.”
[3]The U.S. National Oceanic and Atmospheric Administration (NOAA) provides a very detailed polynomial expansion for the approximation to the dangerous heat index threshold, T, given the relative humidity, R, but I daresay R = 100−6(T −90) is much simpler. Maybe even easier is the series of the first three square numbers, 1–4–9: 100F at 40% and 90F at 100%. NOAA provides a fine description of heat effects and symptoms at www.nws.noaa.gov/om/brochures/heat_wave.shtml
[4]Information comes from a report by the Centers for Disease Control (CDC 1995).