6. 3 Ozone, SO2, & Asthma
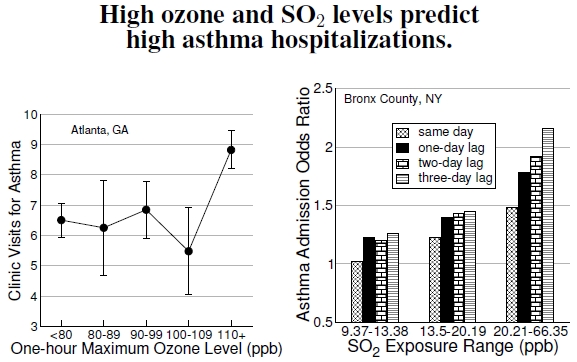
Figure 6.3: At left, daily asthma admissions for children, aged 1 to 16, in an Atlanta, Georgia, public hospital during the summer of 1990 showed a marked increase when one-hour ozone levels exceeded 110 ppb (after White et al. 1994). The right-hand plot summarizes asthma admissions for children aged 0–14 years old from Bronx County, New York, between June 1991 and December 1993. The odds of being admitted to the hospital for asthma differ between the four quartiles (dividing the distribution into four equal parts) of the SO2 concentration distribution, with admissions rates for the lowest quartile defining admission odds of 1.0 (after Lin et al. 2004). Not only do higher pollutant levels increase admission odds, but odds depend most on the SO2 concentration three days prior to admission.
Air pollution causes an array of health problems, including heart problems, cancer, and altered immune responses.[6] Exposure to ozone and allergens can cause asthma, an inflammation of the small (<1 mm) bronchioles in the lungs. The upper respiratory tract absorbs, for example, highly water-soluble sulfur dioxide (SO2), and the subsequent irritation constricts the airway.[7] These exposures affect children in particular because of their less-developed lungs and immune systems.[8]
Figure 6.3 demonstrates how two types of air pollution affect the frequency of asthma attacks. One dataset (the left plot) from the Grady Memorial Hospital in Atlanta, Georgia, a hospital that served a low-income, predominantly black population, shows that the highest ozone days have 37% higher pediatric asthma hospitalizations. Unfortunately, the results come from a small sample of patients, just 609 hospital visits for children aged 1 to 16; this means that the results have relatively weak statistical strength. The other plot, on the right, shows that in Bronx County, New York, childhood asthma admissions and SO2 data have a similar pattern when adjusted for race, age, and season.[9] In New York, 8.6% of children aged 0–17 suffer from asthma, substantially more than children in other low-income areas in the United States. Between the lowest and highest quartiles, asthma admissions odds increased by a factor of 1.48 to 2.16 based on average daily SO2 levels, and 1.55 to 1.86 based on maximum daily SO2 levels. Admission rates also depend on the lag between high pollution day and admission day.[10]
Other studies from Atlanta confirm these results. Ozone levels above 100 ppb increased the odds of asthma hospital admissions one day later by 23% over admission rates when ozone levels were below 50 ppb. Also observed were large increases in asthma admission odds for PM10.[11] More recent studies examined massive numbers of emergency room visits, more than 4 million, from 1993 to 2000.[12] Of these visits, 11% involved respiratory problems, around 172 cases per day. Analysis of combined data for all respiratory diseases, chronic obstructive pulmonary disease, upper respiratory infection, asthma, and pneumonia showed that increasing levels of pollutants, for example, 24-hour PM10, 8-hour O3, and 1-hour NO2, by one standard deviation increased the incidence of respiratory disease by 1.3%, 2.4%, and 1.6%, respectively. Statistical analysis including all pollutants simultaneously gave a tantalizing result that only ozone had any real importance.[13]
Perhaps a better measure of pollution levels were the health implications. During the 1996 Atlanta Olympics period, data from four different sources[14] regarding 1- to 16-year-old children showed reductions in acute asthma events ranging from 11 to 44%, representing a total of 56 fewer admissions during that period. As a control to compare with the asthma admissions, these same sources found changes in nonasthma events ranging from −3.1 to 1.3%.
—————————-
[6]A myriad of health problems brought on by air pollution are discussed by Bernard et al. (2001).
[7]Lin et al. (2004) discuss mechanisms of asthma inducement.
[8]Byrd and Joad (2006) provide two references on age differences in asthma susceptibility.
[9]Lin et al. (2004) and White et al. (1994) discuss asthma emergencies increasing with pollution levels, SO2 and ozone, respectively.
[10]A one-day lag, for example, simply means that one day a person experiences high pollutant levels, and then one day later the hospital admission takes place.
[11]Tolbert et al. (2000) showed the spatial correlations between ozone and asthma admissions in Atlanta, Georgia.
[12]Peel et al. (2005) examined emergency room visits in Atlanta, Georgia, from 1993 to 2000.
[13]The idea that ozone alone accounts mostly for asthma came out of another study from Southern California by Moore et al. (2008). This study also provides maps showing significant reductions in ozone and PM10 from 1983 to 2000.
[14]The four database sources included Medicaid claims, a health maintenance organization, combined emergency department records from two pediatric hospitals, and a hospital discharge database from all of Atlanta’s metropolitan hospitals.
