6. 4 Asthma & Pollution
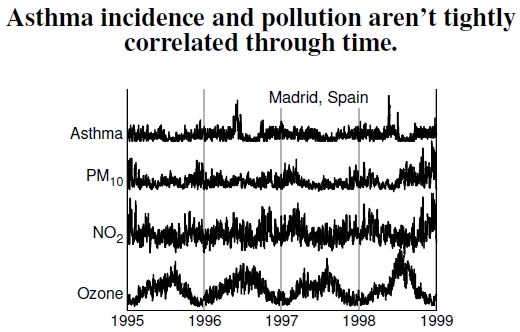
Figure 6.4: Temporal dynamics of pollutants and asthma in Madrid, Spain, from 1995 to 1998 (after Galan et al. 2003). These curves include two asthma epidemics that took place in May 1996 and May 1998, and show the subtle nature and relative weakness of the correlation between asthma and air pollution. In contrast, compare these plots of weakly related variables with tightly related variables, such as the strong 400,000-year correlation between CO2 and temperature in Figure 3.6.
Although the data in Figure 6.3 give a clear mental picture of cause and effect, the connection between health issues and pollution isn’t always so sharp. Figure 6.4 summarizes results from Madrid, Spain’s emergency room admissions for asthma and various pollutant levels over a four-year time span.
When asking how respiratory diseases depend on pollutant levels, this plot demonstrates that the connection isn’t perfect. For example, take a peek at the long-term connection between global CO2 and temperature in Figure 3.6. That plot really needs no accompanying statistical analysis revealing whether or not a correlation exists. Weak correlations like the ones displayed here demonstrate the need for statistical analyses: Certainly the asthma curve doesn’t simply reflect any of the other curves.
Despite the lack of a strong visual connection, statistical analysis indicates that PM10, NO2, and O3 correlate positively and significantly with asthma events, confirming the results of Figure 6.3. A one-day lag in ozone and three-day lags in PM10 and NO2 correlate most stongly.
Yet another study, this time in Taiwan in 2004, found significant correlations between emergency room cases of childhood asthma and NO2, CO, and PM10.[15] In that particular situation, ozone level was not a significant contribution for childhood asthma, and nothing reached significance for adult cases.
Other things besides pollution increase the risk of asthma attacks, including humidity and a rapid decrease from high barometric pressure. One estimate shows that these climatic variables provoke more than 20% of asthma attacks.[16] The asthma-inducing mechanism behind a rapid pressure decrease may be an increased pollen release corresponding with thunderstorms.[17] Incidentally, these studies also considered pollen as a factor for asthma (with ragweed pollen increasing in urban areas; see Figure 3.8), but those results didn’t change the importance of the pollutants. Urbanites also suffer from asthma due to exposure to cockroaches (in the northeastern United States), rodents, dust mites (in the south and northwest), pets, and molds. Living with violence might also increase stresses that promote asthma.[18]
In summary, these results demonstrate that asthma has a complicated and messy dependence on air pollution, and ozone isn’t the only pollutant that matters, despite my focus on it here.
————————————
15Sun et al. (2006) examined asthma cases in Taiwan.
16Hashimoto et al. (2004) discuss a range of environmental features that increase the risk of asthma attacks, including a rapid decrease in temperature, humidity, and pressure.
17D‘Amato et al. (2007) talk about pollen release, with thunderstorms being a potential cause of asthma attacks.
18Byrd and Joad (2006) describe a multitude of urban-related causes of asthma.
