6. 2 Bad PM
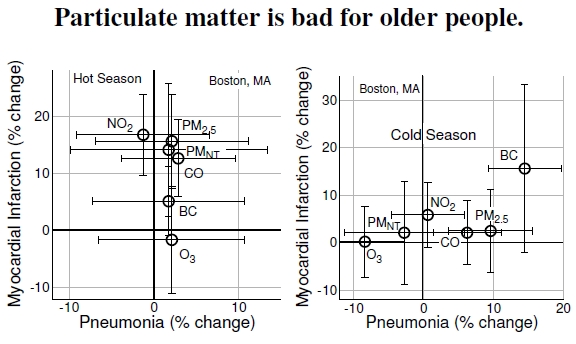
 Figure 6.2: A large study from Boston, Massachusetts, connected air pollution levels to hospital admission rates of patients aged 65 years and older, an age group most susceptible to the effects of heat (see Figure 6.1). Dividing the data into “hot” (left) and “cold” (right) seasons, these plots present the percentage changes between hospital admissions between periods of high and low levels of the various pollutants (after Zanobetti and Schwartz 2006). For example, in the cold season, high levels of black carbon (BC) correspond to about 15% higher admissions for both myocardial infarction (heart attack) and pneumonia when compared to low levels of BC. Error bars show the 95% confidence intervals.
The two plots in Figure 6.2, one for hot and one for cold seasons, examine emergency department admissions from 1995 to 1999 for 15,578 heart attack (myocardial infarction) patients and 24,857 pneumonia patients aged 65 and older.[5] Researchers matched each of these emergency room admissions with the pollution level on admission day. Pulling out days with the lowest and highest pollution levels — specifically the bottom and top 10% — they tested whether there was a difference between admission rates in these tails of the pollution distributions. Further, they separately examined differences in excess admissions for “cold” (October to March) and “hot” (April to September) seasons—lots of data and lots of tests.
The short answer: Air pollution exacerbates pneumonia in the winter and heart attacks in the summer. For example, the plots show that black carbon in the hot season causes no difference in admissions for pneumonia, but comparing the lowest and highest pollution concentrations in the cold season shows that black carbon causes about a 15% increase in hospitalizations. Error bars show the limits that demarcate the 95% confidence interval, a standard level of significant effect. What does that mean? Suppose the world went back in time to the beginning of the study period, and, although the pollution levels played out the same, everybody got a new chance at getting struck with pneumonia or a heart attack. If this rewinding happened 20 times, statisticians expect that measurements from 19 of those rewindings would fall within the 95% confidence interval (0.95 = 19/20). Coming back to black carbon in the cool season, one is tempted to see it correlated with heart attacks, but that bottom limit sneaks just below zero. This temptation induces scientists to find larger databases with more cases, hoping to reduce the confidence interval, perhaps revealing such a correlation as significant.
Pneumonia in winter significantly correlates with black carbon (BC), carbon monoxide (CO), and PM2.5. Summertime pneumonia hospitalizations show no connection to any of the pollutants. Regarding heart attacks, CO had the greatest effect in the summer, along with NO2, PM2.5, and non-traffic particulate matter, labeled PMNT .
Although ozone appears to reduce pneumonia incidence in winter, reduced ozone levels correlate with higher levels of the other pollutants, which correlate with higher hospital admission rates. Perhaps this correlation comes through here. Or perhaps ozone provided some protective benefit from pneumonia to this population. Whatever is going on here, the next study shows an example of harmful ozone.
————————
[5]Zanobetti and Schwartz (2006) studied pollution effects on health in the greater Boston area.