Polyglot programming
Python 2
Interactive widgets
For more examples
%matplotlib inline
import matplotlib.pyplot as plt
import numpy as np
from IPython.html.widgets import interactive
from IPython.display import display
:0: FutureWarning: IPython widgets are experimental and may change in the future.
from scipy.stats import beta
plt.style.use('ggplot')

def dist(a=1, b=1):
    x = np.linspace(0, 1, 100)
    pdf = beta.pdf(x, a, b)
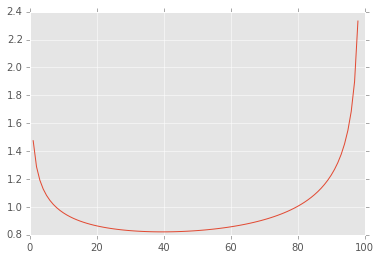
    plt.plot(pdf)
    return pdf

widget = interactive(dist, a=(0.0, 5.0), b=(0.0, 5.0))
widget.background_color = 'lightsalmon'
display(widget)

widget.close()
# Currnet settings of variables
widget.kwargs
{'a': 0.8, 'b': 0.7}
# Current value of function
pdf = widget.result
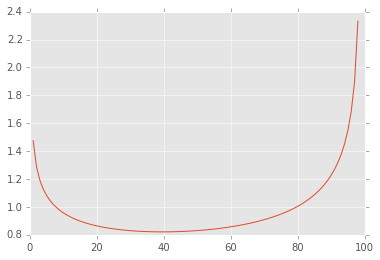
plt.plot(pdf);

Bokeh
More examples
from bokeh.plotting import *
from bokeh.models import ColumnDataSource
output_notebook()
N = 300
x = np.linspace(0, 4*np.pi, N)
y1 = np.sin(x)
y2 = np.cos(x)

source = ColumnDataSource()
source.add(data=x, name='x')
source.add(data=y1, name='y1')
source.add(data=y2, name='y2');
TOOLS = "pan,wheel_zoom,box_zoom,reset,save,box_select,lasso_select"

s1 = figure(tools=TOOLS, plot_width=350, plot_height=350)
s1.scatter('x', 'y1', source=source)

# Linked brushing in Bokeh is expressed by sharing data sources between
# renderers. Note below that s2.scatter is called with the `source`
# keyword argument, and supplied with the same data source from s1.scatter
s2 = figure(tools=TOOLS, plot_width=350, plot_height=350)
s2.scatter('x', 'y2', source=source);
p = gridplot([[s1,s2]])
show(p)
Python 3
Extended iterator unpacking
def f(*args):
    if len(args) < 2:
        return args
    else:
        first, *_, last = args
        return first, last

f(1,2,3,4,5)
(1, 5)
Memoization
from functools import lru_cache

@lru_cache(maxsize=None)
def fib(n):
    if n < 2:
        return n
    return fib(n-1) + fib(n-2)

print(fib(100))
print(fib.cache_info())
354224848179261915075
CacheInfo(hits=98, misses=101, maxsize=None, currsize=101)
Bash
grep lru_cache Multikernel.ipynb | tail -n 2 | wc
2 10 90
for i in `ls`
do
    echo File: $i
done
File: Jupyter.ipynb
File: ModulesAndPackaging.ipynb
File: MultiKernel.ipynb
File: foo.py
File: pkg
File: sta663
R
install.packages("plyr", repos="http://cran.us.r-project.org")
The downloaded binary packages are in
    /var/folders/bh/x038t1s943qftp7jzrnkg1vm0000gn/T//Rtmpa5E0hb/downloaded_packages
d <- data.frame(year = round(runif(10, 2000, 2005)), count = round(runif(10, 0, 10)))

library(plyr)
ddply(d, 'year', mutate, mu=mean(count), sigma=sd(count), cv=mu/sigma)
   year count       mu    sigma       cv
1  2001     4 2.333333 1.527525 1.527525
2  2001     1 2.333333 1.527525 1.527525
3  2001     2 2.333333 1.527525 1.527525
4  2003     6 4.250000 3.947573 1.076611
5  2003     9 4.250000 3.947573 1.076611
6  2003     1 4.250000 3.947573 1.076611
7  2003     1 4.250000 3.947573 1.076611
8  2004     3 5.000000 2.828427 1.767767
9  2004     7 5.000000 2.828427 1.767767
10 2005     2 2.000000       NA       NA
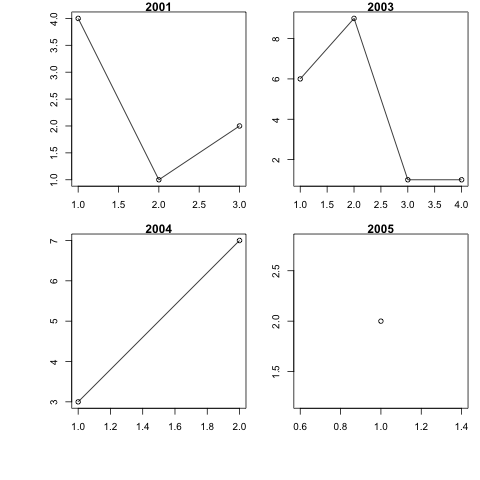
par(mfrow=c(2,(1+length(unique(d$year)))/2), mar = c(3,3,1,1), oma=c(3,3,0,0))
d_ply(d, 'year', transform, plot(count, main=unique(year), type='o'))

Scala
(1 to 10) filter (_ % 2 == 0) map (x => x * x) reduce(_ + _)
220
val x = 2 +: 3 +: 5 +: 8 +: Seq.empty
(x.head, x.tail)
(2,List(3, 5, 8))
Julia
m1 = hcat(repeat([1:2],inner=[1],outer=[3*2]),
          repeat([1:3],inner=[2],outer=[2]),
          repeat([1:4],inner=[3],outer=[1]))
m1
12x3 Array{Int64,2}:
 1  1  1
 2  1  1
 1  2  1
 2  2  2
 1  3  2
 2  3  2
 1  1  3
 2  1  3
 1  2  3
 2  2  4
 1  3  4
 2  3  4
Prolog
child(stephanie).
child(thad).
mother_child(trude, sally).

father_child(tom, sally).
father_child(tom, erica).
father_child(mike, tom).

sibling(X, Y)      :- parent_child(Z, X), parent_child(Z, Y).

parent_child(X, Y) :- father_child(X, Y).
parent_child(X, Y) :- mother_child(X, Y).
Rule added to database.
Rule added to database.
Rule added to database.
Rule added to database.
Rule added to database.
Rule added to database.
Rule added to database.
Rule added to database.
Rule added to database.
father_child(Father, Child)?
Use 'continue' for more results.
{u'Father': tom, u'Child': sally}
continue
Use 'continue' for more results.
{u'Father': tom, u'Child': erica}
continue
Use 'continue' for more results.
{u'Father': mike, u'Child': tom}
continue
No more results.
Processing
Example below one of many from https://processing.org/examples/
float theta;

void setup() {
  size(640, 360);
}

void draw() {
  background(0);
  frameRate(30);
  stroke(255);
  // Let's pick an angle 0 to 90 degrees based on the mouse position
  float a = (mouseX / (float) width) * 90f;
  // Convert it to radians
  theta = radians(a);
  // Start the tree from the bottom of the screen
  translate(width/2,height);
  // Draw a line 120 pixels
  line(0,0,0,-120);
  // Move to the end of that line
  translate(0,-120);
  // Start the recursive branching!
  branch(120);

}

void branch(float h) {
  // Each branch will be 2/3rds the size of the previous one
  h *= 0.66;

  // All recursive functions must have an exit condition!!!!
  // Here, ours is when the length of the branch is 2 pixels or less
  if (h > 2) {
    pushMatrix();    // Save the current state of transformation (i.e. where are we now)
    rotate(theta);   // Rotate by theta
    line(0, 0, 0, -h);  // Draw the branch
    translate(0, -h); // Move to the end of the branch
    branch(h);       // Ok, now call myself to draw two new branches!!
    popMatrix();     // Whenever we get back here, we "pop" in order to restore the previous matrix state

    // Repeat the same thing, only branch off to the "left" this time!
    pushMatrix();
    rotate(-theta);
    line(0, 0, 0, -h);
    translate(0, -h);
    branch(h);
    popMatrix();
  }
}
Sketch #2: