from __future__ import division
import os
import sys
import glob
import matplotlib.pyplot as plt
import numpy as np
import pandas as pd
%matplotlib inline
%precision 4
plt.style.use('ggplot')
np.random.seed(1234)
import pymc
import scipy.stats as stats
Using PyMC2
Install PyMC2 with
conda install -c pymc pymc
Coin toss
We’ll repeat the example of determining the bias of a coin from observed coin tosses. The likelihood is binomial, and we use a beta prior.
n = 100
h = 61
alpha = 2
beta = 2

p = pymc.Beta('p', alpha=alpha, beta=beta)
y = pymc.Binomial('y', n=n, p=p, value=h, observed=True)
m = pymc.Model([p, y])
mc = pymc.MCMC(m, )
mc.sample(iter=11000, burn=10000)
plt.hist(p.trace(), 15, histtype='step', normed=True, label='post');
x = np.linspace(0, 1, 100)
plt.plot(x, stats.beta.pdf(x, alpha, beta), label='prior');
plt.legend(loc='best');
[-----------------100%-----------------] 11000 of 11000 complete in 1.5 sec
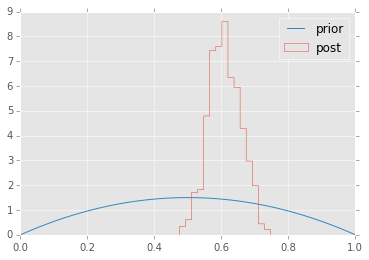
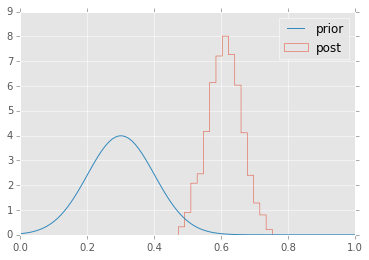
Since the computer is doing all the work, we don’t need to use a conjugate prior if we have good reasons not to.
p = pymc.TruncatedNormal('p', mu=0.3, tau=10, a=0, b=1)
y = pymc.Binomial('y', n=n, p=p, value=h, observed=True)
m = pymc.Model([p, y])
mc = pymc.MCMC(m)
mc.sample(iter=11000, burn=10000)
plt.hist(p.trace(), 15, histtype='step', normed=True, label='post');
a, b = plt.xlim()
x = np.linspace(0, 1, 100)
a, b = (0 - 0.3) / 0.1, (1 - 0.3) / 0.1
plt.plot(x, stats.truncnorm.pdf(x, a, b, 0.3, 0.1), label='prior');
plt.legend(loc='best');
[-----------------100%-----------------] 11000 of 11000 complete in 1.5 sec
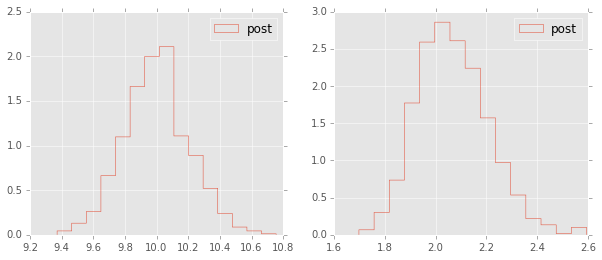
Estimating mean and standard deviation of normal distribution
# generate observed data
N = 100
y = np.random.normal(10, 2, N)

# define priors
mu = pymc.Uniform('mu', lower=0, upper=100)
tau = pymc.Uniform('tau', lower=0, upper=1)

# define likelihood
y_obs = pymc.Normal('Y_obs', mu=mu, tau=tau, value=y, observed=True)

# inference
m = pymc.Model([mu, tau, y])
mc = pymc.MCMC(m)
mc.sample(iter=11000, burn=10000)
[-----------------100%-----------------] 11000 of 11000 complete in 3.2 sec
plt.figure(figsize=(10,4))
plt.subplot(121)
plt.hist(mu.trace(), 15, histtype='step', normed=True, label='post');
plt.legend(loc='best');
plt.subplot(122)
plt.hist(np.sqrt(1.0/tau.trace()), 15, histtype='step', normed=True, label='post');
plt.legend(loc='best');
Estimating parameters of a linear regreession model
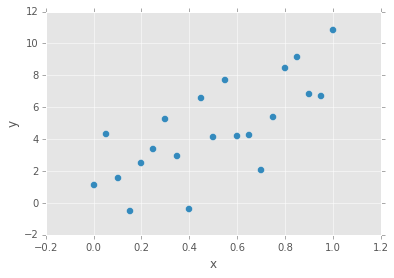
We will show how to estimate regression parameters using a simple linear modesl
We can restate the linear model
as sampling from a probability distribution
Now we can use pymc to estimate the paramters \(a\), \(b\) and \(\sigma\) (pymc2 uses precision \(\tau\) which is \(1/\sigma^2\) so we need to do a simple transformation). We will assume the following priors
Here we need a helper function to let PyMC know that the mean is a deterministic function of the parameters \(a\), \(b\) and \(x\). We can do this with a decorator, like so:
@pymc.deterministic
def mu(a=a, b=b, x=x):
    return a*x + b
# observed data
n = 21
a = 6
b = 2
sigma = 2
x = np.linspace(0, 1, n)
y_obs = a*x + b + np.random.normal(0, sigma, n)
data = pd.DataFrame(np.array([x, y_obs]).T, columns=['x', 'y'])
data.plot(x='x', y='y', kind='scatter', s=50);
# define priors
a = pymc.Normal('slope', mu=0, tau=1.0/10**2)
b = pymc.Normal('intercept', mu=0, tau=1.0/10**2)
tau = pymc.Gamma("tau", alpha=0.1, beta=0.1)

# define likelihood
@pymc.deterministic
def mu(a=a, b=b, x=x):
    return a*x + b

y = pymc.Normal('y', mu=mu, tau=tau, value=y_obs, observed=True)

# inference
m = pymc.Model([a, b, tau, x, y])
mc = pymc.MCMC(m)
mc.sample(iter=11000, burn=10000)
[-----------------100%-----------------] 11000 of 11000 complete in 6.1 sec
abar = a.stats()['mean']
bbar = b.stats()['mean']
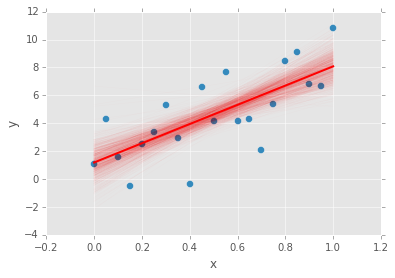
data.plot(x='x', y='y', kind='scatter', s=50);
xp = np.array([x.min(), x.max()])
plt.plot(a.trace()*xp[:, None] + b.trace(), c='red', alpha=0.01)
plt.plot(xp, abar*xp + bbar, linewidth=2, c='red');
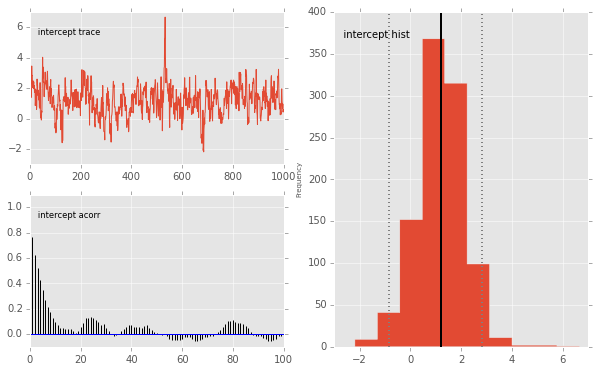
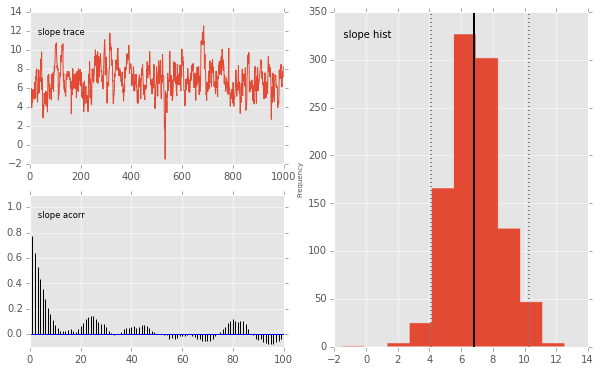
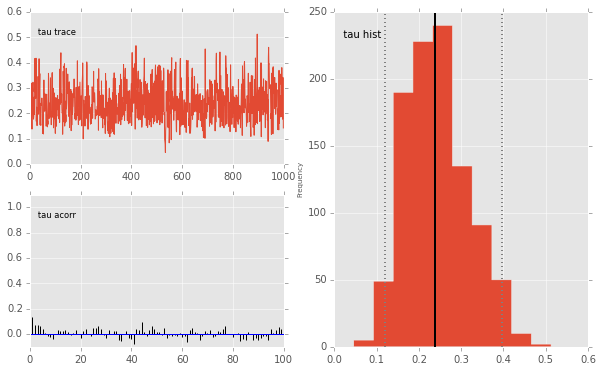
pymc.Matplot.plot(mc)
Plotting intercept
Plotting slope
Plotting tau
/Users/cliburn/anaconda/lib/python2.7/site-packages/numpy/core/fromnumeric.py:2507: VisibleDeprecationWarning: rank is deprecated; use the ndim attribute or function instead. To find the rank of a matrix see numpy.linalg.matrix_rank.
  VisibleDeprecationWarning)
Estimating parameters of a logistic model
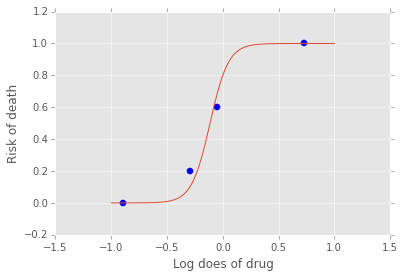
Gelman’s book has an example where the dose of a drug may be affected to the number of rat deaths in an experiment.
| Dose (log g/ml) | # Rats | # Deaths |
|---|---|---|
| -0.896 | 5 | 0 |
| -0.296 | 5 | 1 |
| -0.053 | 5 | 3 |
| 0.727 | 5 | 5 |
We will model the number of deaths as a random sample from a binomial distribution, where \(n\) is the number of rats and \(p\) the probabbility of a rat dying. We are given \(n = 5\), but we believve that \(p\) may be related to the drug dose \(x\). As \(x\) increases the number of rats dying seems to increase, and since \(p\) is a probability, we use the following model:
where we set vague priors for \(\alpha\) and \(\beta\), the parameters for the logistic model.
# define invlogit function
def invlogit(x):
    return pymc.exp(x) / (1 + pymc.exp(x))
# observed data
n = 5 * np.ones(4)
x = np.array([-0.896, -0.296, -0.053, 0.727])
y_obs = np.array([0, 1, 3, 5])

# define priors
alpha = pymc.Normal('alpha', mu=0, tau=1.0/5**2)
beta = pymc.Normal('beta', mu=0, tau=1.0/10**2)

# define likelihood
p = pymc.InvLogit('p', alpha + beta*x)
y = pymc.Binomial('y_obs', n=n, p=p, value=y_obs, observed=True)

# inference
m = pymc.Model([alpha, beta, y])
mc = pymc.MCMC(m)
mc.sample(iter=11000, burn=10000)
[-----------------100%-----------------] 11000 of 11000 complete in 6.9 sec
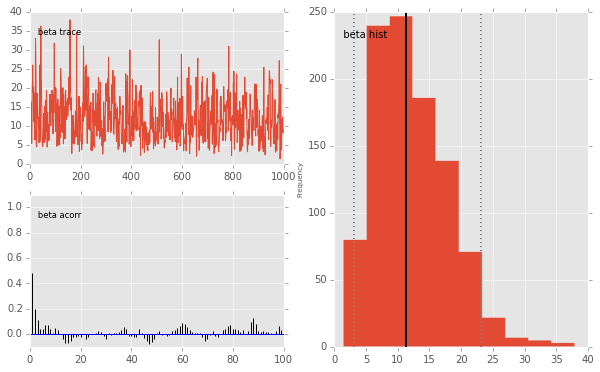
beta.stats()
{'95% HPD interval': array([  3.1131,  23.0992]),
 'mc error': 0.2998,
 'mean': 12.1401,
 'n': 1000,
 'quantiles': {2.5000: 3.5785,
  25: 7.5365,
  50: 11.3823,
  75: 15.9492,
  97.5000: 25.4258},
 'standard deviation': 5.8260}
xp = np.linspace(-1, 1, 100)
a = alpha.stats()['mean']
b = beta.stats()['mean']
plt.plot(xp, invlogit(a + b*xp).value)
plt.scatter(x, y_obs/5, s=50);
plt.xlabel('Log does of drug')
plt.ylabel('Risk of death');
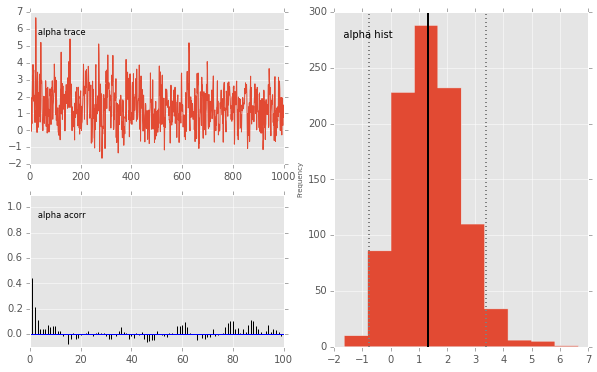
pymc.Matplot.plot(mc)
Plotting alpha
Plotting beta
Using a hierarchcical model
This uses the Gelman radon data set and is based off this IPython notebook. Radon levels were measured in houses from all counties in several states. Here we want to know if the preence of a basement affects the level of radon, and if this is affected by which county the house is located in.
The data set provided is just for the state of Minnesota, which has 85
counties with 2 to 116 measurements per county. We only need 3 columns
for this example county, log_radon, floor, where floor=0
indicates that there is a basement.
We will perfrom simple linear regression on log_radon as a function of county and floor.
radon = pd.read_csv('radon.csv')[['county', 'floor', 'log_radon']]
radon.head()
| county | floor | log_radon | |
|---|---|---|---|
| 0 | AITKIN | 1 | 0.832909 |
| 1 | AITKIN | 0 | 0.832909 |
| 2 | AITKIN | 0 | 1.098612 |
| 3 | AITKIN | 0 | 0.095310 |
| 4 | ANOKA | 0 | 1.163151 |
We will be creating lots of similar models, so it is worth wrapping definitions into a function to avoid repetition.
def make_model(x, y):
    # define priors
    a = pymc.Normal('slope', mu=0, tau=1.0/10**2)
    b = pymc.Normal('intercept', mu=0, tau=1.0/10**2)
    tau = pymc.Gamma("tau", alpha=0.1, beta=0.1)

    # define likelihood
    @pymc.deterministic
    def mu(a=a, b=b, x=x):
        return a*x + b

    y = pymc.Normal('y', mu=mu, tau=tau, value=y, observed=True)

    return locals()
Pooled model
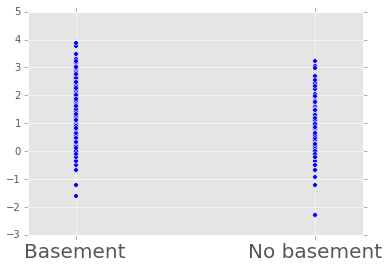
If we pool the data across counties, this is the same as the simple linear regression model.
plt.scatter(radon.floor, radon.log_radon)
plt.xticks([0, 1], ['Basement', 'No basement'], fontsize=20);
m = pymc.Model(make_model(radon.floor, radon.log_radon))
mc = pymc.MCMC(m)
mc.sample(iter=1100, burn=1000)
[-----------------100%-----------------] 1100 of 1100 complete in 5.2 sec
abar = mc.stats()['slope']['mean']
bbar = mc.stats()['intercept']['mean']
radon.plot(x='floor', y='log_radon', kind='scatter', s=50);
xp = np.array([0, 1])
plt.plot(mc.trace('slope')()*xp[:, None] + mc.trace('intercept')(), c='red', alpha=0.1)
plt.plot(xp, abar*xp + bbar, linewidth=2, c='red');
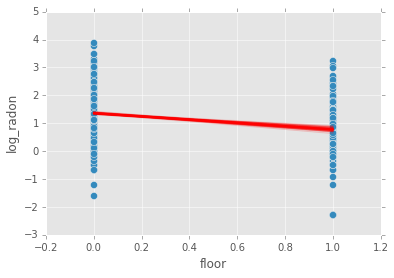
Individual couty model
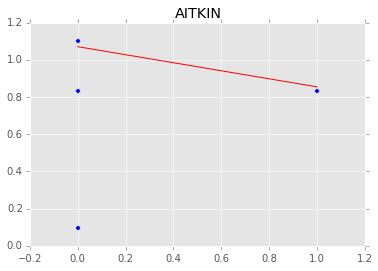
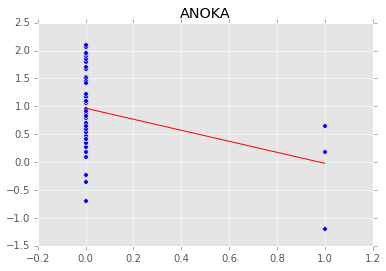
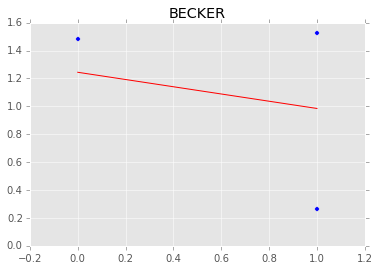
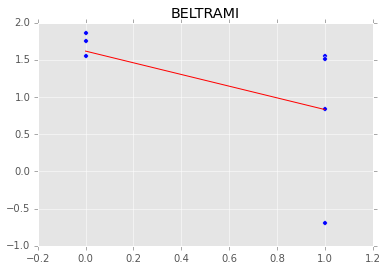
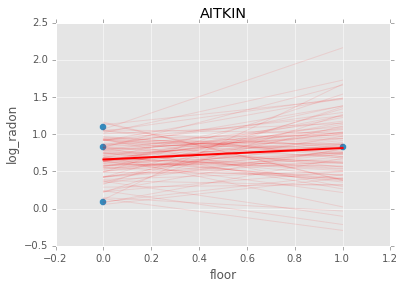
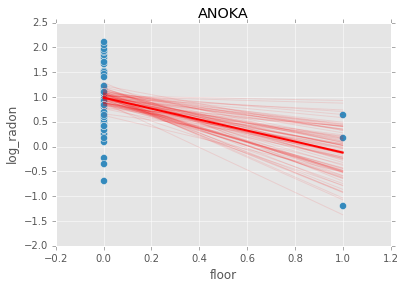
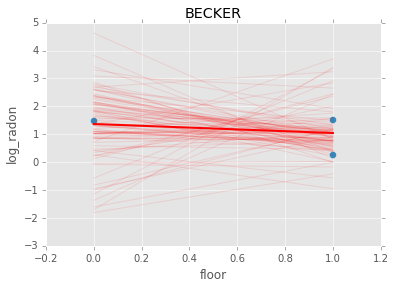
Inidividual couty models are done in the same way, except that we create a model for each county.
n = 0
i_as = []
i_bs = []
for i, group in radon.groupby('county'):

    m = pymc.Model(make_model(group.floor, group.log_radon))
    mc = pymc.MCMC(m)
    mc.sample(iter=1100, burn=1000)

    abar = mc.stats()['slope']['mean']
    bbar = mc.stats()['intercept']['mean']
    group.plot(x='floor', y='log_radon', kind='scatter', s=50);
    xp = np.array([0, 1])
    plt.plot(mc.trace('slope')()*xp[:, None] + mc.trace('intercept')(), c='red', alpha=0.1)
    plt.plot(xp, abar*xp + bbar, linewidth=2, c='red');
    plt.title(i)

    n += 1
    if n > 3:
        break
[-----------------100%-----------------] 1100 of 1100 complete in 3.0 sec
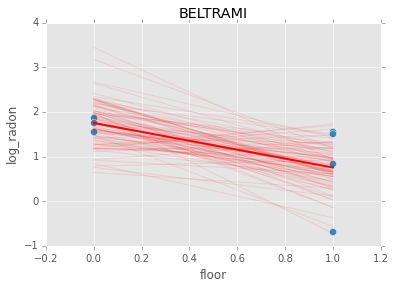
Hiearchical model
With a hierarchical model, there is an \(a_c\) and a \(b_c\) for each county \(c\) just as in the individual couty model, but they are no longer indepnedent but assumed to come from a common group distribution
we furhter assume that the hyperparameters come from the following distributions
county = pd.Categorical(radon['county']).codes

# County hyperpriors
mu_a = pymc.Normal('mu_a', mu=0, tau=1.0/100**2)
sigma_a = pymc.Uniform('sigma_a', lower=0, upper=100)
mu_b = pymc.Normal('mu_b', mu=0, tau=1.0/100**2)
sigma_b = pymc.Uniform('sigma_b', lower=0, upper=100)

# County slopes and intercepts
a = pymc.Normal('slope', mu=mu_a, tau=1.0/sigma_a**2, size=len(set(county)))
b = pymc.Normal('intercept', mu=mu_b, tau=1.0/sigma_b**2, size=len(set(county)))

# Houseehold priors
tau = pymc.Gamma("tau", alpha=0.1, beta=0.1)

@pymc.deterministic
def mu(a=a, b=b, x=radon.floor):
    return a[county]*x + b[county]

y = pymc.Normal('y', mu=mu, tau=tau, value=radon.log_radon, observed=True)
m = pymc.Model([y, mu, tau, a, b])
mc = pymc.MCMC(m)
mc.sample(iter=110000, burn=100000)
[-----------------100%-----------------] 110000 of 110000 complete in 235.1 sec
abar = a.stats()['mean']
bbar = b.stats()['mean']
xp = np.array([0, 1])
for i, (a, b) in enumerate(zip(abar, bbar)):
    plt.figure()
    idx = county == i
    plt.scatter(radon.floor[idx], radon.log_radon[idx])
    plt.plot(xp, a*xp + b, c='red');
    plt.title(radon.county[idx].unique()[0])
    if i >= 3:
        break
