2.14 Transpiring Trees
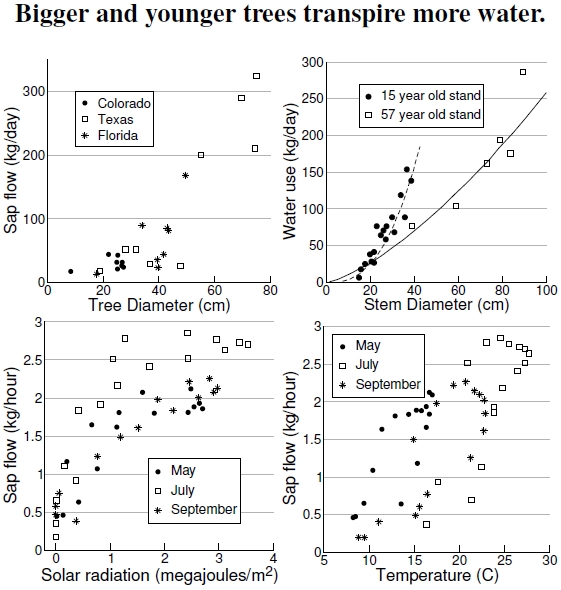
Figure 2.14: The top left graph shows the amount of sap flow in midsummer versus tree size, measured as the diameter at breast height (DBH), averaged over several species from several places (after Vose et al. 2003). At top right, a comparison of two Eucalyptus regnans stands shows that water use decreases with stand age (after Wullschleger et al. 1998; stem diameter resembles DBH). The bottom plots show sap flow, from several tree species in central Colorado, as a function of light (bottom left) and heat (bottom right) during spring, summer, and fall.
Now let’s come back to cooling. Figure 2.10 showed how evaporation, the all-important cooling method for our own bodies, takes up a lot of heat and in the process cools whatever object gives up the heat. How much potential exists for trees to cool cities through their transpiration? Recall that transpiration involves water evaporating from the small pores in leaves called stomata. Evaporation of water out these pores draws sap up the tree, with the soon-to-be-evaporated water entering the roots and coming from the soil (Figure 3.5). The graph at top left in Figure 2.14 shows sap flow rates for varying tree sizes, averaged over a dozen or so tree species from several locations across the United States. Data in the top right graph show that young Eucalyptus trees transpire more than old ones, thus, perhaps, providing better cooling services.[44] For scale, the parking lot trees I showed in Figure 2.12 have a diameter of about 25 cm.
As a tree’s environment changes, so do its photosynthesis rates and, thus, its transpiration rates. The bottom graphs show that more light and heat cause trees to transpire more water.[45] Solar radiation maxes out at full sunlight, but trees start to fail and die at too high of temperatures, but beyond the range shown here (see Figure 2.15).
According to these graphs, we might hope for a sap flow of about 30 kg per day from a 25 cm DBH tree, and, from Figure 2.13, we might hope for a natural crown width of about 6 m, meaning a crown projection area of about 30 m2. Dividing that water use by the crown projection area gives roughly 1 kg/m2/day, working out to about 1 mm of water per m2 each day. A bigger tree of 60 cm DBH also provides about 1 kg/m2/day transpiration.[46] At either size, the sap flow matches the 1 mm of evaporating water needed to cool a paved surface, as I calculated in Figure 2.10. Trees cool!
Of course, this calculation ignores the fact that if the tree were shading the asphalt, then the asphalt wouldn’t need cooling, but the motivating hope was that trees provide significant, citywide cooling benefits.
Here’s yet another hopeful approach: Reduce the urban heat island (in the absence of rain or shade) by pouring water on hot roadways (assuming water sources aren’t constrained). A quick estimate shows that a 4,000-gallon water truck would cover about 2 km (1.2 miles) of an 8 m wide road with 1 mm of water. Perhaps in high-impact areas such a strategy would be worthwhile, but it seems unlikely, given what would certainly be an inefficient endeavor in terms of labor, transportation costs, and added vehicle emissions in hot urban areas.
————————————————
[44]Vose et al. (2003) and Wullschleger et al. (1998) provide sap flow data for different places and tree species.
[45]Vose et al. (2003) present transpiration data for trees as functions of light and heat, and Lu et al. (2003) show evapotranspiration versus precipitation in southeastern U.S. watersheds.
[46]An even broader scale measure comes from Hoover (1944), who reports measurements before and after a logging operation in the North Carolina Appalachian Mountain range. Results show that the annual transpiration by the intact forest totaled 48.7 cm over an entire year, and dividing by 365 days gives an average of about 1.3 mm per day.
